Your cart is currently empty!
Analyzing Time Metrics in Web Analytics: Measuring Engagement and Traffic Quality with Google Analytics 4 and Looker Studio
Table of Contents
- Google Analytics 4: Measuring Time Metrics
- Challenges in Time Metrics Accuracy
- Frequently Asked Questions About Time Metrics in Web Analytics
- What are time metrics in web analytics?
- Why are time metrics important in web analytics?
- What is the difference between time on page and average session duration?
- How can businesses use time metrics to improve their websites?
- What are some challenges in measuring time metrics accurately?
- How can businesses optimize time metrics to improve user engagement?
Time metrics are a cornerstone of web analytics, providing invaluable insights into user behavior, engagement, and traffic quality. These metrics help businesses understand how visitors interact with their websites, which can significantly influence decision-making processes in marketing, content strategy, and user experience design. By analyzing time-based data, companies can gauge the effectiveness of their online presence and the success of their awareness campaigns.
For instance, time on page measures the average duration a user spends on a single page, indicating the relevance and engagement level of the content. A longer time on page generally suggests that visitors find the content valuable and engaging. Conversely, a short time on page may highlight issues such as uninteresting content, poor design, or mismatched user expectations.
Similarly, average session duration (or visit duration) tracks the average time users spend on a website during a single session. This metric provides a broader view of engagement across the entire site, rather than focusing on individual pages. High average session duration can imply that users are exploring multiple pages and content types, indicating a strong overall user experience.
Time to conversion is another critical metric, measuring the time it takes for a visitor to complete a desired action, such as making a purchase or signing up for a newsletter. This metric is crucial for understanding the efficiency of the conversion process and identifying potential bottlenecks that may delay user actions.
In multi-step processes, time between funnel steps helps in analyzing the efficiency of each stage in the user journey. By measuring the time users take to move from one step to the next, businesses can identify stages that may need optimization to reduce drop-offs and improve the overall conversion rate.
These metrics, among others, offer a comprehensive view of user engagement and traffic quality. They enable businesses to identify strengths and weaknesses in their web presence, optimize user journeys, and tailor content to better meet user needs. In the subsequent sections, we will delve deeper into these metrics, exploring their specific applications and how they can be effectively leveraged in tools like Google Analytics 4, and Looker Studio.
Google Analytics 4: Measuring Time Metrics
Google Analytics 4 (GA4), the most popular web analytics tool, offers several ways to measure time metrics. However, these metrics can be fragmented and inconsistent across different sections of the tool, making them less beneficial in the context of growth marketing or performance monitoring.
Engagement Metrics and Traffic Quality
Exploration Section Metrics
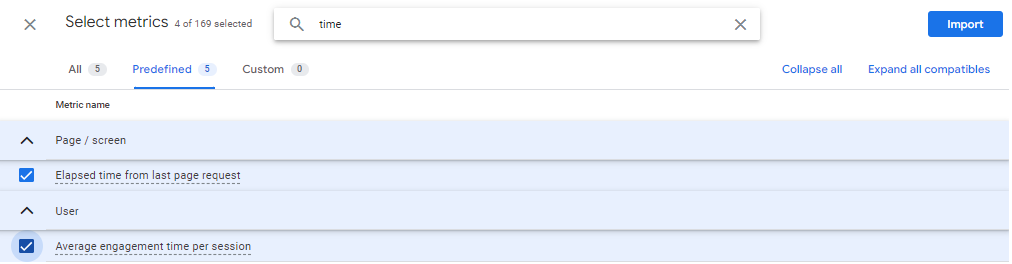
In the Exploration section of Google Analytics, two key time metrics are available:
- Elapsed Time from Last Page Request: This metric measures the average time in seconds it takes for each event to load, calculated from the time of the last user-initiated page request. Despite its availability, this metric is not particularly significant for understanding user engagement as it primarily focuses on load times rather than interaction time.
- Average Engagement Time per Session: This metric provides an overview of the time users actively engage with content during a session. While useful, the Exploration section’s complexity and lack of clarity can make it challenging to derive actionable insights from these metrics.
Default Reporting Section Metrics
In the default reporting section with report templates, more accessible and customizable metrics can be found:
- Average Session Duration: This metric helps understand the overall time users spend on the site during a session. It’s useful for gauging user engagement across the site.
- Average Engagement Time: This metric indicates how long users interact with specific pages. It can be particularly useful for assessing the performance of individual pages.
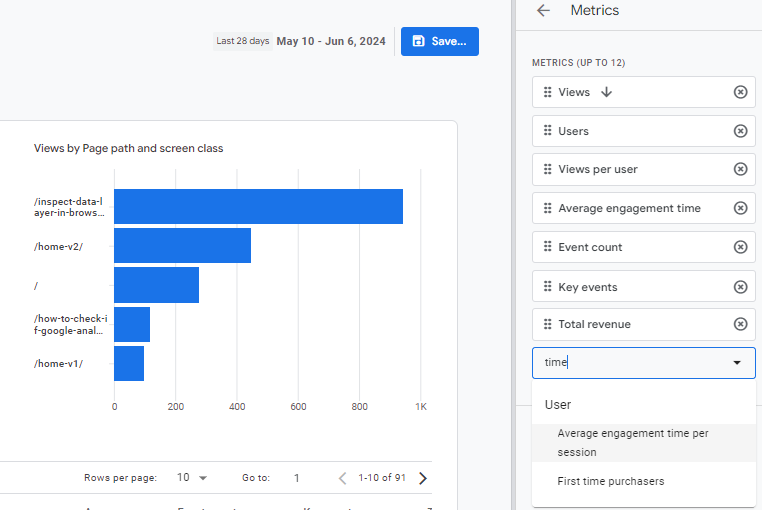
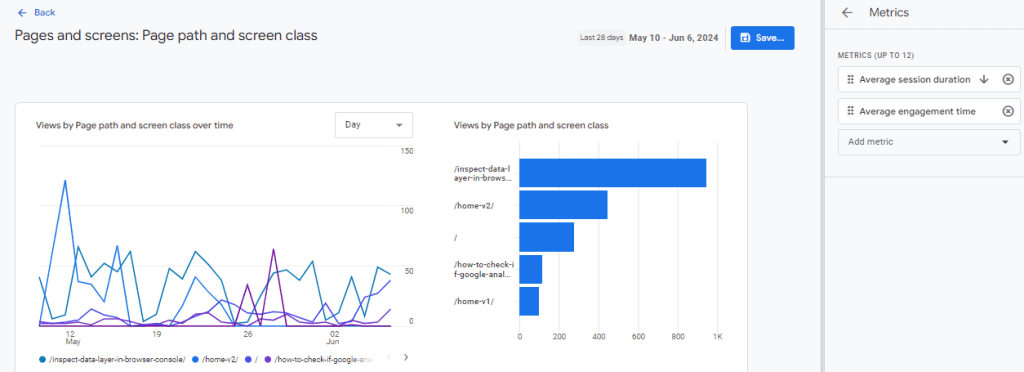 These metrics may not be immediately visible in all reports but can be added by customizing the report view. To do this, click the pencil icon on the top right, go to Metrics, and add the desired metric from the “Add metric” drop-down menu, save and publish your new report template.
Challenges in Time Metrics Accuracy
Despite the variety of metrics, Google Analytics’ method of measuring time is not entirely precise. GA4 calculates time metrics by measuring the difference between timestamps of page view events. This method works well with multiple page views but is less effective for single page views or the last page view before users leave the website, as there are no subsequent events to timestamp. This missing data piece makes the measurement mechanism imprecise.
Funnel and Attribution Metrics
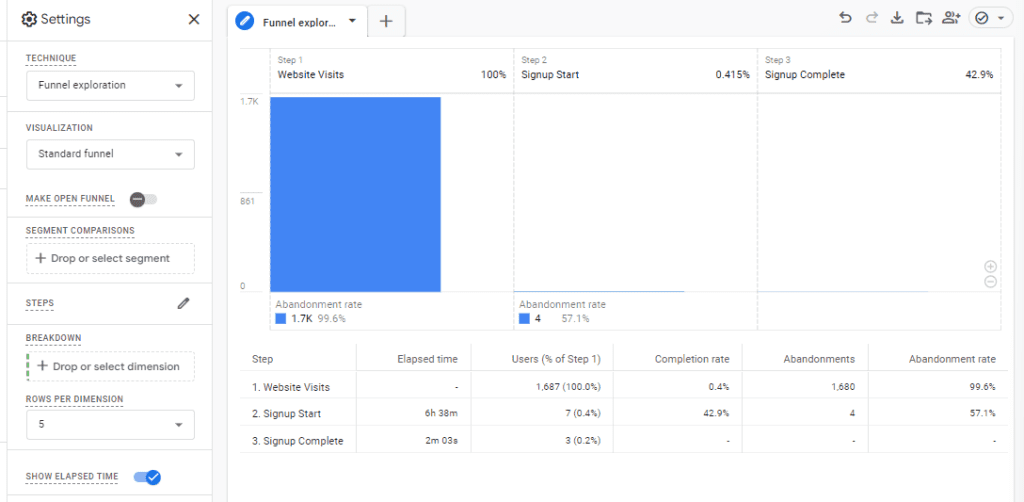
- Elapsed Time Between Funnel Steps: In the funnel visualization within the Exploration section, GA4 can automatically calculate the time between configured steps. This feature is particularly useful for understanding the efficiency of the user journey through different stages of the funnel. To enable this, switch on the toggle “SHOW ELAPSED TIME.”
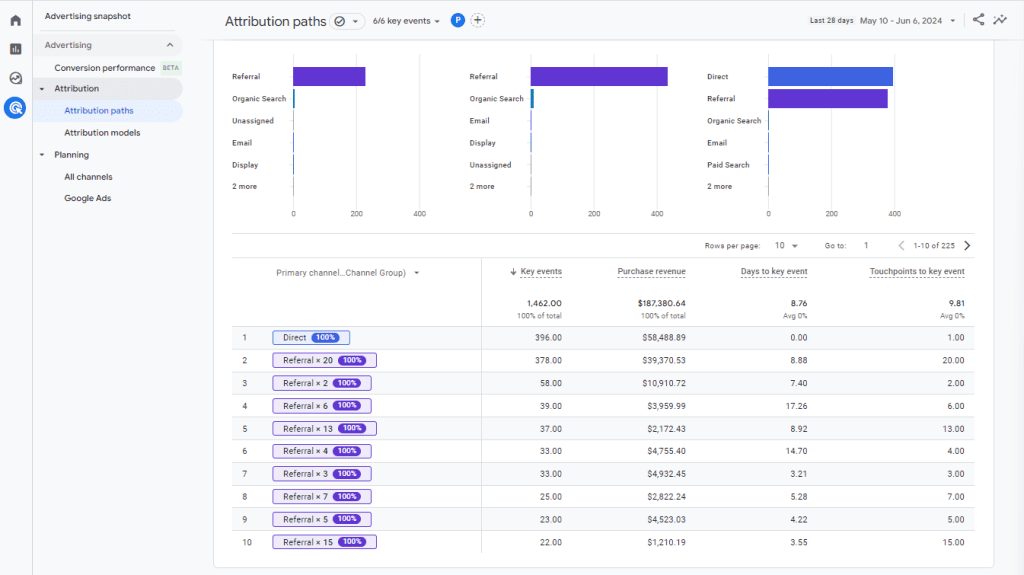
- Days to Key Event (Conversion): In the advertising section under attribution paths, GA4 provides an estimate of the days to conversion. This metric helps in understanding how long it typically takes for users to convert after their initial interaction with the site. It is crucial for evaluating the performance of marketing campaigns and the user journey towards conversion.
Understanding Time Metrics in Looker Studio’s Google Analytics Integration
In Looker Studio’s integration with Google Analytics, two additional metrics are introduced that differ from typical use cases and naming conventions you can see in Google Analytics.
 The first metric, “Average Session Duration,” is consistent with Google Analytics terminology and represents the average length of a session. It is calculated as the total duration of all sessions divided by the number of sessions.
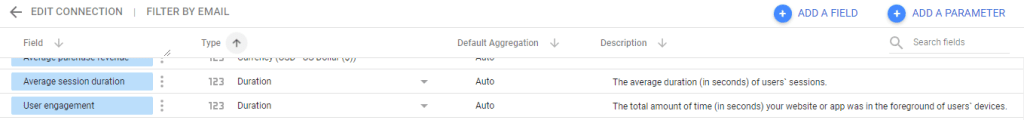
The second metric, “User Engagement,” may initially appear unrelated to time metrics just from its name. However, it actually represents the total time spent by all users on the website or app. This metric provides a broader view of user activity beyond individual session durations.
To delve deeper on using the the “User Engagement” metric, it’s possible to analyze user behavior further by calculating the average time spent on each page by creating new metrics with the “User Engagement” metric as a starting point. This can be achieved by creating a custom metric using the formula: User Engagement / Views. Here, “Views” represents the total number of page or screen views. Creating this custom metric allows for a more granular understanding of user interaction with specific pages or screens.
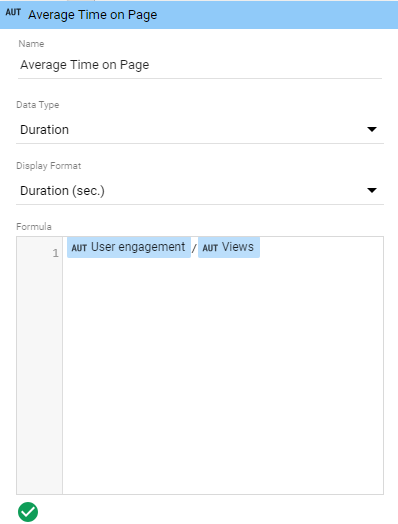
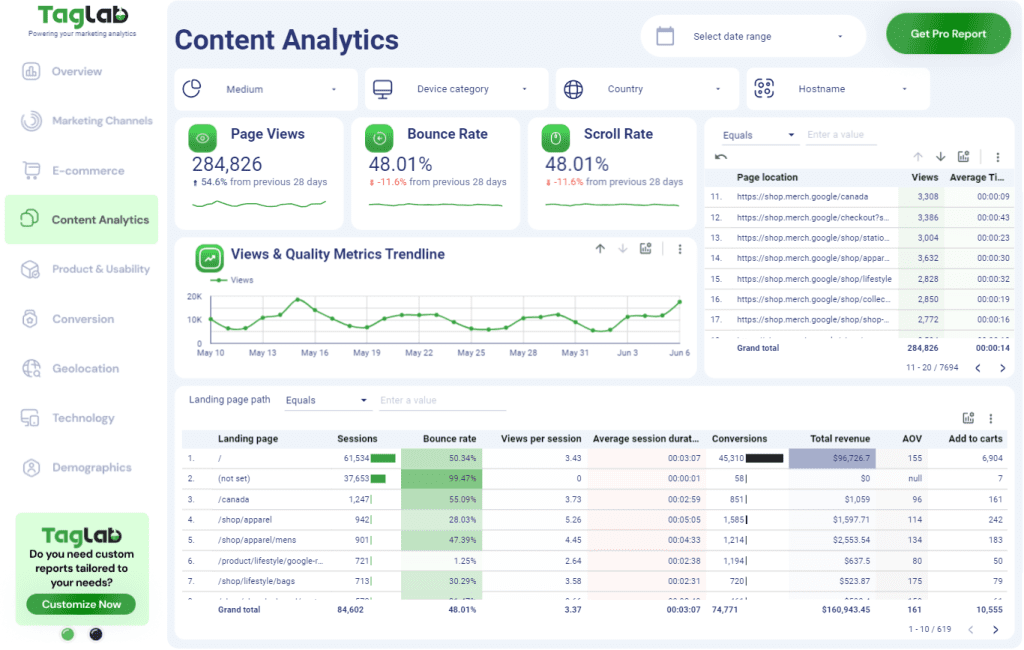
An “Average Time on Page” calculated feild, can be used with the specific page related dimensions such as Full Page URL or Page Path to start obtaining meaningful insights from the time metrics as indicators to measure traffic quality and engagement effectiveness.
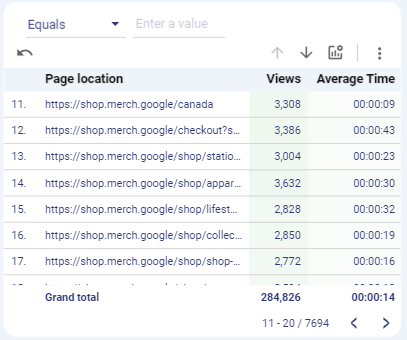
Incorporating an ‘Average Time on Page’ calculated field into your analysis, alongside page-related dimensions, such as Full Page URL or Page Path, can provide valuable insights into traffic quality and engagement. Check out my dashboard below to see these principles in action, and explore other great marketing dashboards for further inspiration!
Frequently Asked Questions About Time Metrics in Web Analytics
What are time metrics in web analytics?
Time metrics in web analytics refer to measurements of the duration users spend on a website or a specific page. These metrics help businesses understand user behavior, engagement levels, and the effectiveness of their online content.
Why are time metrics important in web analytics?
Time metrics are important in web analytics because they provide insights into user engagement and content effectiveness. They help businesses make informed decisions about marketing strategies, content creation, and user experience design.
What is the difference between time on page and average session duration?
Time on page measures the average duration a user spends on a single page, indicating the content’s relevance and engagement level. Average session duration, on the other hand, tracks the average time users spend on a website during a single session, providing a broader view of engagement across the entire site.
How can businesses use time metrics to improve their websites?
Businesses can use time metrics to identify areas for improvement on their websites. For example, a high bounce rate coupled with a low time on page may indicate that the content is not engaging enough, prompting businesses to reevaluate their content strategy or user experience design.
What are some challenges in measuring time metrics accurately?
One challenge in measuring time metrics accurately is the method used by analytics tools, such as Google Analytics, which calculates time metrics by measuring the difference between timestamps of page view events. This method may not be precise for single page views or the last page view before users leave the website.
How can businesses optimize time metrics to improve user engagement?
Businesses can optimize time metrics by improving the quality and relevance of their content, enhancing the overall user experience, and ensuring that their website loads quickly and is easy to navigate.