Your cart is currently empty!
Implement Page Average Scroll Rate Tracking for Google Analytics 4 with GTM
Posted by:
|
On:
|
Table of Contents
- Implementing Scroll Threshold Custom Metric to Track Scroll Depth in GA4 with Google Tag Manager
- Implementing Scroll Rate in GA4 as a Calculated Metric
- Page Scroll Rate for Enhanced Reporting and Conversion Rate Optimization
- Frequently Asked Questions about Scroll Depth in GA4
- What is scroll rate (also known as scroll depth) and why is it important in GA4?
- How do you calculate scroll rate in GA4?
- How can scroll rate data improve website conversion rates?
- What reporting techniques can be used with scroll rate data in GA4?
- Can scroll rate be linked to specific user behaviors in GA4?
Google Analytics 4 (GA4) indeed offers a scroll event that allows tracking the scroll percentage. However, when this event triggers at every defined percentage range, it may lack depth in providing meaningful insights into user engagement. This is particularly evident as the metric doesn’t inherently offer an average scroll percentage per page, limiting the depth of analysis.
To enhance the analysis of user engagement and gain more comprehensive insights, it’s crucial to move beyond a simplistic triggering mechanism at defined percentage ranges. Instead, consider implementing a method that calculates and captures the average scroll percentage per page. This approach allows for a more nuanced understanding of how users interact with the content on each specific page.
To address this limitation, we’ll leverage the power of Google Tag Manager and GA4’s calculated metrics feature to implement custom scroll rate events.
Implementing Scroll Threshold Custom Metric to Track Scroll Depth in GA4 with Google Tag Manager
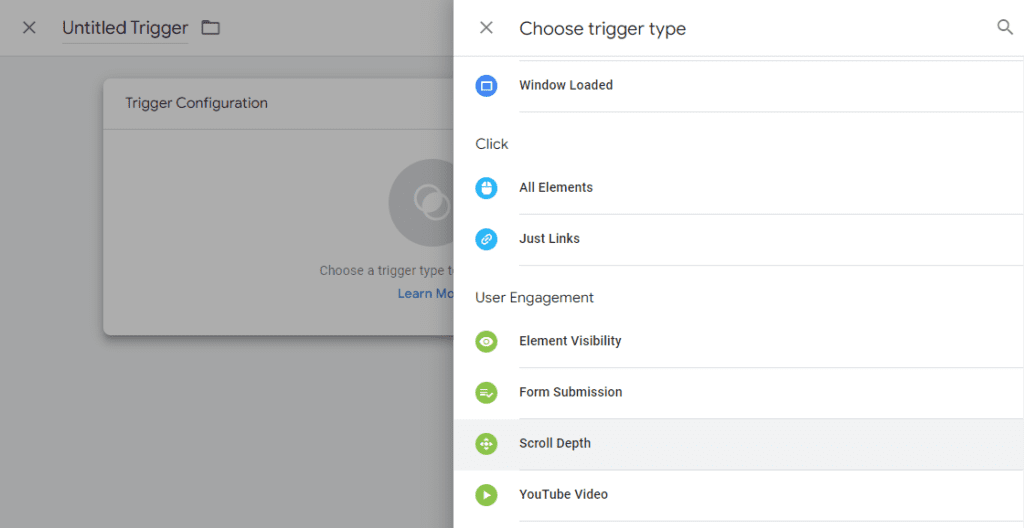
Google tag manager can detect and fire events based on scrolls. To achieve this we need to set a scroll trigger. So in Google Tag Manager start by creating a new “Scroll Depth” trigger as shown below:
 Then give your trigger a proper name, and configure it with the desired intervals as shown here for the trigger settings. You can set it to trigger on all pages, or on custom pages that you need as shown here:
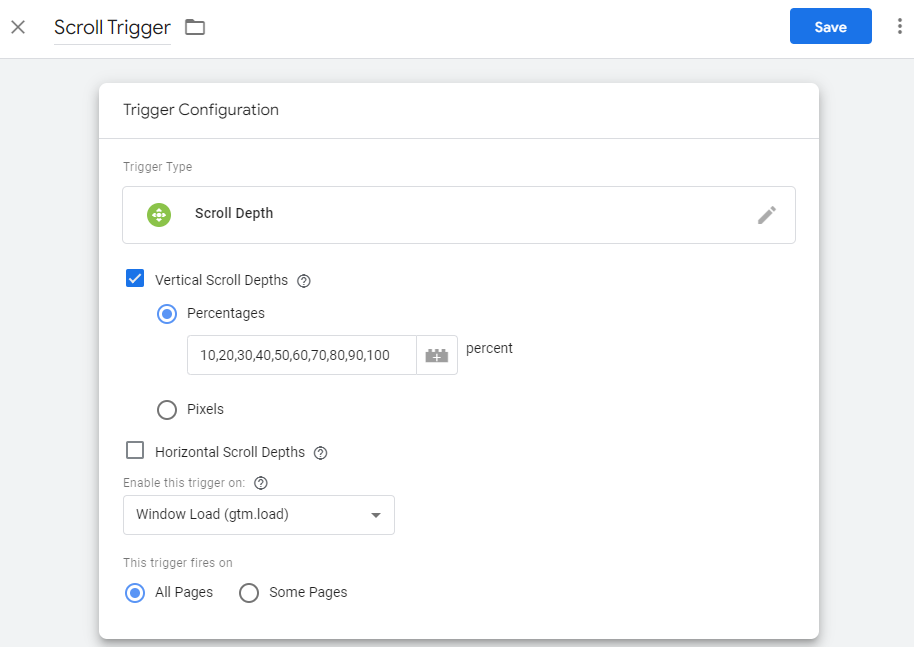 Afterwards, you would need to create the event tag and set it to fire with the created trigger. Set intervals at an incremental equal amount (for example of +10s or +20s) because in the next step we will use this amount to pass a custom metric that will accumulate the number every time the event is triggered. If you have a high volume website, +20 is more than enough to reduce the ammount of events that your GA4 instance recieves.
Implementing Scroll Rate in GA4 as a Calculated Metric
Now that you have created your trigger, it’s time to create an event tag for Google Analytics 4. Name your event, create a property called “scroll_amount”, and set the property value as a number that is equal to the same interval of percentages you set in the trigger. For example 20.
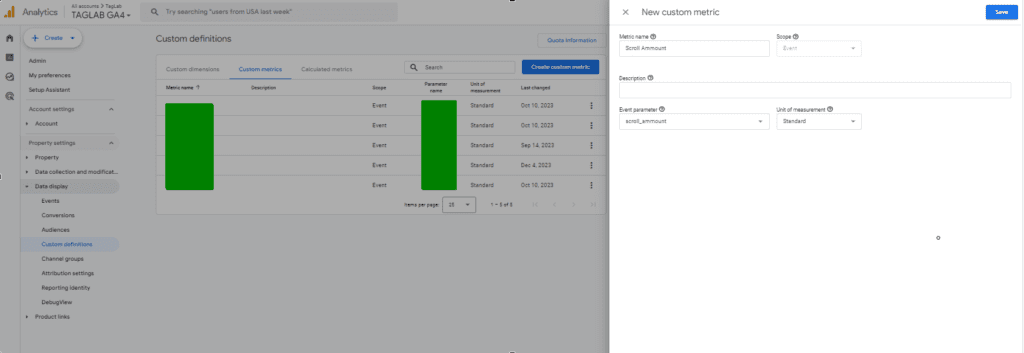
 Save your tag, and publish your container. Then head to GA4 > Admin > Custom Definitions > Custom Metrics and create a new custom metric on an event level with the name Scroll Amount and event parameter “scroll_amount”. Now you can measure the accumulated ammount of scrolls on each page or per session.
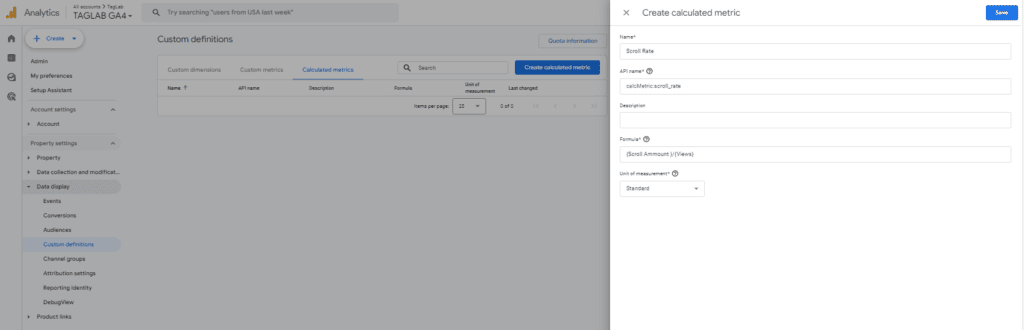
 In the next step, head to the “Calculated Metrics” section under the “Custom definitions” tab, then give the new metric a name, for example “Scroll Rate”. Afterwards apply the formula ({Scroll Ammount }/{Views}), so that it is possible to divide the total accumulated scroll amount by the number of page views and keep the “Unit of measurement” as Standard.
 Congratulations! Now you can start monitoring average scroll depth for each page by using this new metric in Exploration Reports, or by adding it in the default report templates. Don’t forget to debug and test your implementation on your real website. To do so, use the TAGLAB extension to validate that the scroll_amount event accurately. Make sure to test the following so that you can be sure that your scroll rate metric is working accurately:
- Scrolling an entire page
- There should be a total of 5 scroll event if you set the intervals at 20%
- Each event should be triggering the scroll amount “20”
- The sum of the total amount of scrolls should be exactly 100
Page Scroll Rate for Enhanced Reporting and Conversion Rate Optimization
Reporting on Scroll Rate in GA4
Once you’ve set up the scroll depth measurment through the scroll rate tracking with GTM and GA4, you can use this metric to create detailed reports that help understand user engagement on specific pages. Here’s how you can use the scroll rate for reporting:
- Exploration Reports: Use GA4’s Exploration tool to build custom reports where you can analyze the scroll rate alongside other metrics like session duration, bounce rate, and page views. For instance, by correlating scroll rate with session duration, you can infer if deeper scrolling leads to longer stays on the page.
- Audience Segmentation: Segment your audience based on their scroll behavior to target users who exhibit higher engagement. For example, create an audience segment of users who scroll more than 75% of your key landing pages to understand their characteristics and behavior better.
- Benchmarking and Trend Analysis: Regularly track and compare the scroll rates of different landing pages or across time periods. Identifying trends or drops in scroll rates can highlight areas of the site that may need content updates or design improvements.
Leveraging Scroll Rate for Conversion Rate Optimization
Scroll rate data can also be instrumental in optimizing conversion rates by guiding content and layout adjustments:
- Content Placement: Analyze scroll depth to determine the optimal placement for key calls-to-action (CTAs). If most users scroll only 50% of the way down a page, place important CTAs above this point.
- A/B Testing: Conduct A/B tests where you vary the amount of content above the fold or the layout of your page elements based on scroll depth insights. Monitor how changes affect both scroll behavior and conversions.
- Heatmaps and User Recordings: Combine scroll rate data with heatmaps and user recording tools to get a visual understanding of user interactions on the page. This combination can provide deeper insights into why certain areas of the page perform better or worse in engaging users.
- Tailored Content Strategies: If analysis shows that deeper scrolling correlates with higher conversion rates, you might consider strategies that encourage scrolling, such as storytelling, progressive disclosure, or interactive elements that engage users.
- Optimization Feedback Loop: Use the insights gained from monitoring scroll rate to continuously refine and optimize the page. This iterative process helps in fine-tuning both content and design to maximize user engagement and conversion potential.
By leveraging scroll rate data in these ways, you can create a more engaging user experience that not only retains attention but also drives conversions. Ensure you use Google Tag Manager and GA4 effectively to track, analyze, and optimize based on this crucial metric.
Frequently Asked Questions about Scroll Depth in GA4
What is scroll rate (also known as scroll depth) and why is it important in GA4?
Scroll rate measures how far users scroll down a page, expressed as a percentage of the page height. It’s important in GA4 as it provides insights into user engagement beyond what typical metrics like page views and bounce rate can offer. A higher scroll rate often indicates more content engagement, which can be critical for optimizing page layout and content strategies.
How do you calculate scroll rate in GA4?
Scroll rate in GA4 can be calculated by setting up scroll depth tracking in Google Tag Manager. This involves creating a scroll depth trigger and an associated tag that fires at specified scroll intervals (e.g., every 25%). GA4 then collects these events, allowing you to calculate the average scroll depth per session or per page view.
How can scroll rate data improve website conversion rates?
Scroll rate data can be used to optimize website conversion rates by informing where to place key elements like calls-to-action (CTAs). If data shows that most users don’t scroll past 50% of the page, placing CTAs above this point can potentially increase interactions and conversions. Furthermore, understanding scroll patterns helps in optimizing the content layout to enhance user engagement and guide users towards conversion points.
What reporting techniques can be used with scroll rate data in GA4?
Scroll rate data in GA4 can be analyzed using Exploration reports to correlate with other metrics, such as session duration and bounce rates. Segmenting users based on their scroll behaviors for targeted analysis and integrating scroll data with heatmap tools for visual insights are effective techniques. Regular benchmarking of scroll rates also helps identify trends and optimize content strategy.
Can scroll rate be linked to specific user behaviors in GA4?
Yes, scroll rate can be linked to specific user behaviors by segmenting users who exhibit similar scrolling patterns. For example, creating a segment for users who scroll more than 75% of the page can help analyze and understand behaviors of highly engaged users. This data can be crucial for targeting and personalizing marketing strategies to boost engagement and conversions.