Your cart is currently empty!
Google Looker Studio Overview: Essential Features and Best Practices
Table of Contents
- Overview of Google Looker Studio
- Data Connectors to Add Data Sources
- Scheduling Email Reports in Looker Studio
- Data Blends in Looker Studio
- Filters in Looker Studio
- Downloading Data from Looker Studio
- Preventing Unauthorized Copies of Dashboards
- Managing Users in Looker Studio
- Handling Data Credentials and Dashboard Handover
- Conclusion
- Frequently Asked Questions
- What is Google Looker Studio?
- How can I schedule reports in Looker Studio?
- How do I download data from Looker Studio?
- How can I prevent users from copying, downloading, or printing my Looker Studio dashboards?
- How do I add, remove, and manage users in Looker Studio?
- What are the best practices for managing users in Looker Studio?
- How can I handle data credentials and securely hand over a dashboard in Looker Studio?
- What types of data connectors are available in Looker Studio?
- How do I build a custom data connector in Looker Studio?
- What is data blending in Looker Studio?
Google Looker Studio is one such tool that stands out in the among the most popular data analytics and business intelligence stack. It offers robust features that allow users to create comprehensive and visually appealing reports and dashboards. This introduction will provide an overview of Google Looker Studio, highlight the importance of utilizing it for data analytics, and delve into the specifics of scheduling reports within the platform.
 Overview of Google Looker Studio
Google Looker Studio is a cloud-based business intelligence platform that enables organizations to explore, analyze, and share real-time business analytics with ease. It is part of Google’s suite of data and analytics tools and integrates seamlessly with other Google services such as BigQuery, Google Analytics, and Google Cloud Storage, as well as numerous third-party data sources. Looker Studio is designed to cater to a wide range of users, from data analysts and business intelligence professionals to non-technical users who need to derive insights from data.
One of the standout features of Looker Studio is its ability to create custom dashboards and reports. Users can build interactive visualizations using a variety of chart types, tables, and filters. These visualizations can be tailored to display key performance indicators (KPIs), track metrics over time, and highlight important trends. The platform’s intuitive drag-and-drop interface makes it accessible for users with varying levels of technical expertise, ensuring that even those with limited coding knowledge can create powerful data visualizations.
Moreover, Looker Studio supports real-time data exploration and ad-hoc querying, allowing users to dive deep into their data to uncover insights quickly. The platform’s robust modeling layer enables users to define complex data relationships and calculations, making it possible to create advanced analytics models that reflect the unique needs of their business.
Importance of Utilizing Looker Studio for Data Analytics
The importance of utilizing Looker Studio for data analytics cannot be overstated. In an era where data is considered the new oil, having the right tools to extract actionable insights from data is crucial for business success. Looker Studio provides several advantages that make it an indispensable tool for organizations aiming to harness the power of their data.
- Centralized Data Management: Looker Studio allows organizations to centralize their data from multiple sources into a single platform. This eliminates the need for disparate data silos and ensures that all stakeholders have access to consistent and up-to-date information. By consolidating data, businesses can improve data governance and make more informed decisions.
- Enhanced Data Visualization: The platform’s advanced visualization capabilities enable users to present data in a clear and engaging manner. Visualizations help to simplify complex data sets and make it easier for stakeholders to understand trends and patterns. This is particularly important for communicating insights to non-technical audiences, such as executives and business managers.
- Real-Time Analytics: With Looker Studio, users can access real-time data, allowing them to monitor performance and make data-driven decisions on the fly. Real-time analytics is essential for staying competitive in fast-paced industries where timely information can provide a strategic advantage.
- Collaboration and Sharing: Looker Studio facilitates collaboration by enabling users to share reports and dashboards with colleagues and clients. Shared reports can be accessed online, ensuring that everyone is on the same page. The platform’s integration with Google Workspace further enhances collaboration, allowing users to embed reports in Google Sheets, Slides, and other applications.
- Scalability and Flexibility: Looker Studio is designed to scale with the needs of growing businesses. It can handle large volumes of data and complex analytics workflows, making it suitable for organizations of all sizes. The platform’s flexibility allows users to customize their analytics environment to meet specific business requirements.
Data Connectors to Add Data Sources
Google Looker Studio offers a selection of data connectors that allow users to integrate data from a wide range of sources. These connectors are essential for consolidating data, enabling comprehensive analysis and reporting within the platform. There are two main types of data connectors available: native connectors provided by Google and partner connectors offered by third-party providers.
Native Connectors
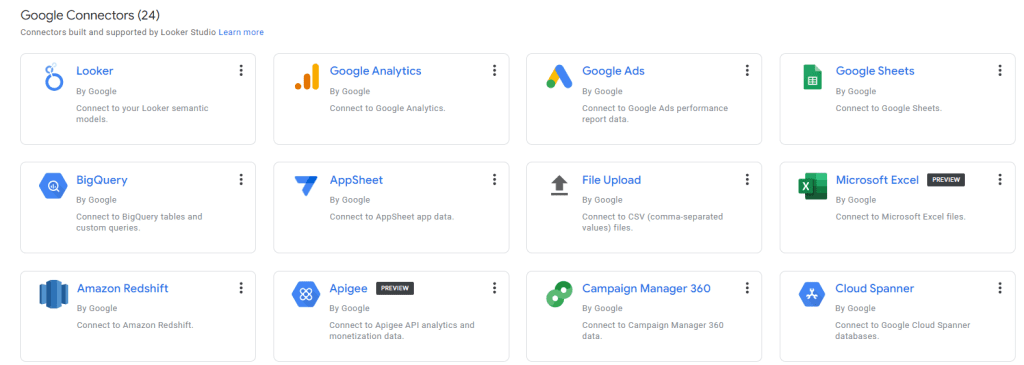 Native connectors are built and maintained by Google, ensuring seamless integration with Google’s ecosystem. These connectors are free to use and are designed to work effortlessly with other Google services.
- Google Analytics: Connects to Google Analytics to import website and app data, including user behavior, traffic sources, and conversion metrics.
- Google Ads: Integrates with Google Ads, allowing users to analyze ad performance metrics such as clicks, impressions, and cost data.
- Google BigQuery: Provides access to Google BigQuery, enabling the analysis of large datasets and complex SQL queries.
- Google Sheets: Imports data from Google Sheets, facilitating the analysis of spreadsheet data alongside other sources.
- Google Cloud Storage: Connects to Google Cloud Storage to access and analyze data stored in the cloud.
- YouTube Analytics: Allows users to access YouTube channel data, including video performance, audience demographics, and engagement statistics.
These native connectors are particularly useful for organizations that rely heavily on Google’s suite of products, as they ensure a high level of compatibility and integration.
Partner Connectors
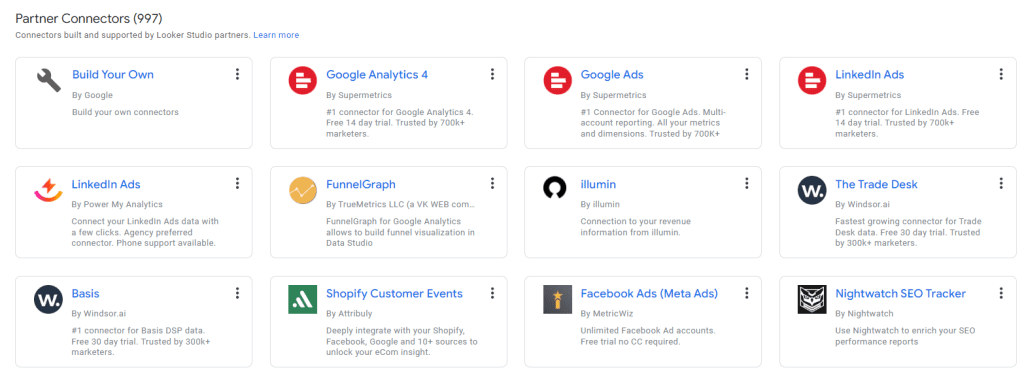 Partner connectors are developed by third-party providers and typically require a subscription or payment. These connectors expand Looker Studio’s capabilities by allowing integration with a wide array of external data sources.
- Supermetrics: Offers connectors for various marketing and social media platforms, including Facebook Ads, Instagram, LinkedIn, and more.
- Funnel.io: Provides connectors for over 500 data sources, such as e-commerce platforms (Shopify), CRM systems (Salesforce), and advertising networks.
- CData: Supplies connectors for numerous databases and cloud services, including SQL Server, Salesforce, and MongoDB.
- Dataddo: Connects to various marketing, sales, and service platforms, supporting extensive data integration and automation.
- Power My Analytics: Provides connectors for advertising and analytics platforms, helping users streamline data collection and reporting.
Benefits of Using Data Connectors
Utilizing data connectors in Looker Studio offers several practical advantages:
- Centralized Data Management: By integrating data from multiple sources into a single platform, organizations can manage their data more effectively and ensure consistency across reports.
- Enhanced Analysis: Access to diverse data sources allows for more comprehensive analysis and insights, aiding in better decision-making.
- Automation: Data connectors automate the import process, reducing the need for manual data entry and preparation, thus saving time and effort.
- Scalability: As organizations grow, data connectors enable Looker Studio to scale, integrating new data sources and handling larger datasets.
- Flexibility: The variety of available connectors allows users to customize their data environment to meet specific business needs.
Build Your Own Data Connector
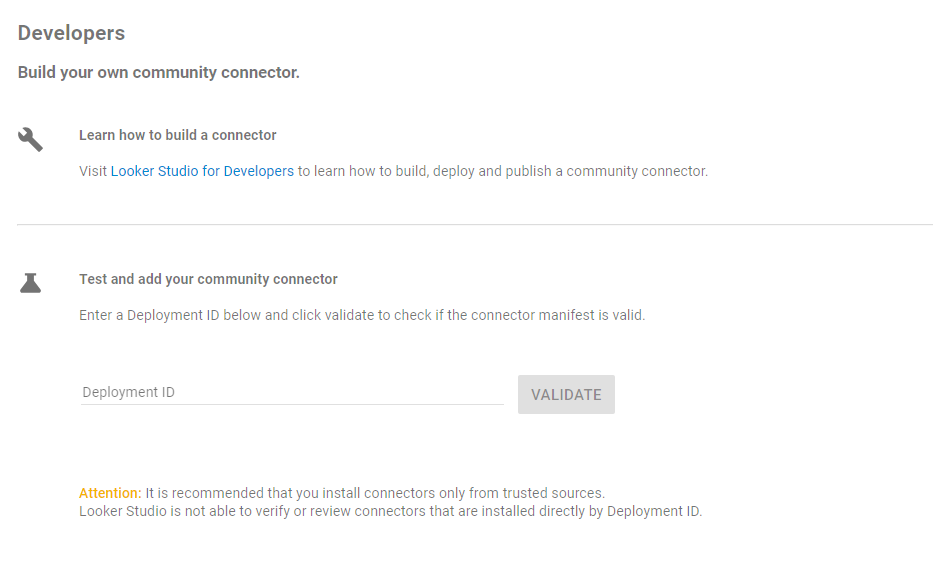 In addition to the native and partner connectors, Google Looker Studio offers the flexibility to create custom data connectors. This “Build Your Own” data connector feature is designed to allow users to integrate virtually any data source into Looker Studio, providing unparalleled flexibility and customization.
What is a Custom Data Connector?
A custom data connector, also known as a Community Connector, is a tool that allows users to fetch data from external sources not covered by the native or partner connectors. These connectors are built using Google Apps Script, a cloud-based scripting language for light-weight application development in the G Suite platform.
Benefits of Building Your Own Data Connector
- Flexibility: Custom data connectors enable users to integrate non-standard or proprietary data sources into Looker Studio.
- Customization: Tailor the data extraction and transformation processes to fit specific business needs and data formats.
- Extensibility: Extend Looker Studio’s capabilities by connecting to virtually any API or data service available.
- Control: Maintain full control over the data connection, including authentication, data retrieval, and processing logic.
How to Build a Custom Data Connector
Building a custom data connector involves several key steps:
- Set Up Google Apps Script: Begin by accessing the Google Apps Script editor. This can be done by navigating to the Google Apps Script homepage and creating a new project.
- Write the Connector Script: Develop the script using JavaScript within the Google Apps Script environment. The script must define several mandatory functions:
getAuthType(): Specifies the authentication method required by the data source.getConfig(): Defines the user configuration options, such as input parameters.getSchema(): Describes the schema of the data, including fields and data types.getData(): Contains the logic for fetching and processing the data from the external source.
- Deploy the Connector: Once the script is written, deploy the connector as a web app. This involves setting up deployment settings and publishing the app.
- Authorize and Test: Authorize the connector to access the necessary data and perform tests to ensure it retrieves and processes the data correctly.
- Use in Looker Studio: After successful deployment and testing, the custom connector can be added to Looker Studio like any other data source.
Example: Creating a Simple Custom Data Connector
Here is a basic example of a custom data connector that fetches data from a fictional REST API:
function getAuthType() {
return { type: "NONE" };
}

function getConfig() {
var cc = DataStudioApp.createCommunityConnector();
var config = cc.getConfig();
config.newTextInput()
.setId("api_key")
.setName("API Key")
.setHelpText("Enter your API key for authentication");
return config.build();
}

function getSchema() {
var cc = DataStudioApp.createCommunityConnector();
var fields = cc.getFields();
var types = cc.FieldType;

fields.newDimension()
.setId("id")
.setName("ID")
.setType(types.TEXT);

fields.newMetric()
.setId("value")
.setName("Value")
.setType(types.NUMBER);

return cc.newGetSchemaResponse()
.setFields(fields)
.build();
}

function getData(request) {
var apiKey = request.configParams.api_key;
var url = "https://api.example.com/data?api_key=" + apiKey;
var response = UrlFetchApp.fetch(url);
var data = JSON.parse(response.getContentText());

var cc = DataStudioApp.createCommunityConnector();
var fields = getSchema().fields;
var rows = [];

data.forEach(function(item) {
rows.push({
values: [item.id, item.value]
});
});

return cc.newGetDataResponse()
.setFields(fields)
.addRows(rows)
.build();
}
Best Practices for Building Custom Data Connectors
- Documentation: Thoroughly document the connector’s setup and usage instructions.
- Security: Implement robust authentication and data security measures to protect sensitive information.
- Error Handling: Include comprehensive error handling to manage API failures or data inconsistencies.
- Testing: Rigorously test the connector with various data scenarios to ensure reliability and accuracy.
- Maintenance: Regularly update and maintain the connector to accommodate API changes and enhancements.
Conclusion
Building your own data connector in Looker Studio empowers users to integrate a wide array of data sources, providing unmatched flexibility and customization. Whether connecting to a proprietary database, a niche API, or any other unique data source, custom connectors ensure that Looker Studio can meet the diverse and evolving needs of any organization. By leveraging Google Apps Script and adhering to best practices, users can create reliable and secure connectors that enhance their data analytics capabilities.
How to Use Data Connectors
To utilize data connectors in Looker Studio, follow these general steps:
- Open Looker Studio: Log in to your Looker Studio account and open the report or dashboard where you want to add data.
- Add Data Source: Click on the “Add Data” button to open the data source selection menu.
- Choose Connector: Select the appropriate connector from the list of available options. For native connectors, choose from the Google services listed. For partner connectors, you may need to install or subscribe to the third-party service.
- Authenticate and Configure: Follow the prompts to authenticate your account and configure the data source settings, including selecting specific datasets or metrics.
- Integrate Data: Once the data source is connected, you can start using the data in your reports and dashboards, creating visualizations and performing analyses as needed.
Understanding and leveraging data connectors in Looker Studio is crucial for effective data integration and analysis. Whether using native connectors for seamless integration with Google services or partner connectors for broader data access, these tools enable users to create comprehensive and insightful reports. By automating data import processes and providing flexibility in data management, Looker Studio’s connectors support informed decision-making and efficient data operations.
Scheduling Email Reports in Looker Studio
One of the key features that make Looker Studio a powerful tool for data analytics is the ability to schedulePDF email reports. Scheduling reports ensures that stakeholders receive timely updates on important metrics without the need for manual intervention. This feature is particularly useful for routine reporting tasks, such as weekly performance summaries, monthly marketing reviews, and daily operational dashboards.
Scheduling reports in Looker Studio is a straightforward process. Users can define the frequency and timing of report delivery, specify recipients, and choose the format in which the reports will be sent.
To schedule a report in Looker Studio, follow these steps:
- Create or Select a Report: Begin by creating a new report or selecting an existing one that you want to schedule. Ensure that the report contains all the necessary data visualizations and filters.
- Configure Scheduling Settings: Access the scheduling settings from the report main upper menu. Click on Share > Schedule Delivery.
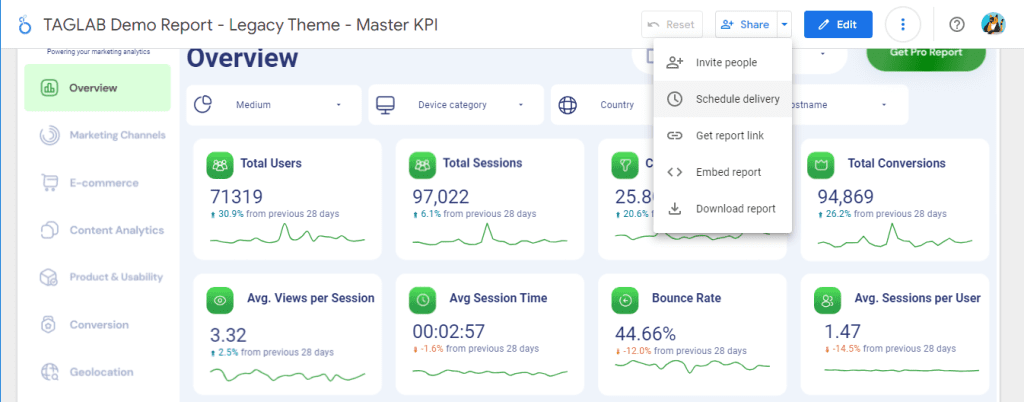
- Add Recipients: Enter the email addresses of the recipients who should receive the report. You can add multiple recipients, ensuring that all relevant stakeholders are included. You can customize the email subject and add a custom message
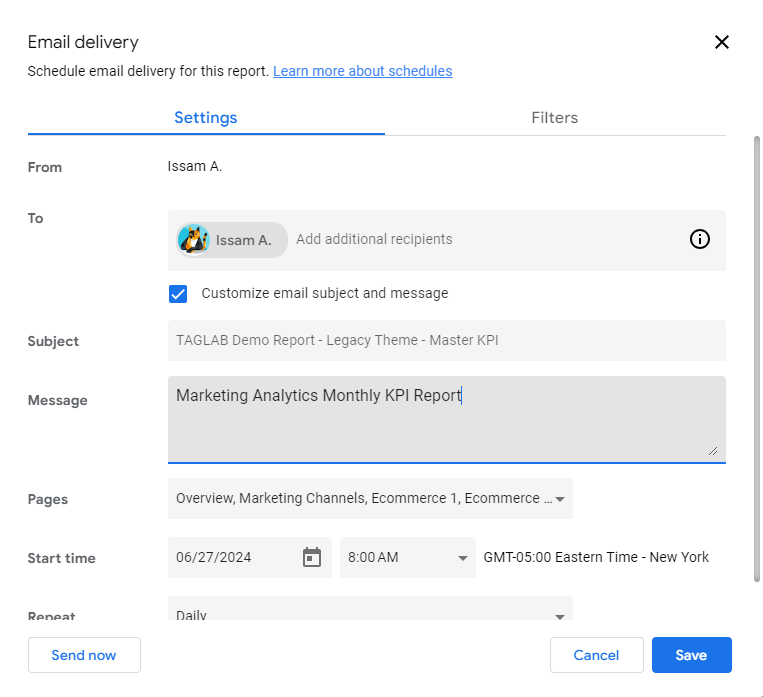
- Choose Report Pages: You can choose the pages that you want your recipients to recieve, or send all the pages visible on the dashboard.
- Choose Delivery Cadence: Define the schedule by specifying the frequency (daily, weekly, monthly) and the exact time for the report to be generated and delivered.
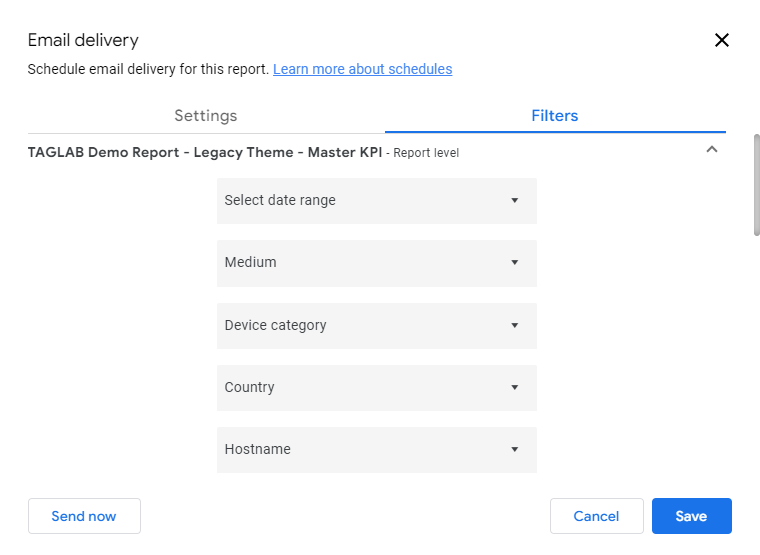
- Set Filters: You can set up filters to be applied for the report schedule using any of the visible filters on each of the pages
- Review and Save: Review the scheduling settings to ensure that everything is configured correctly. A good practice is to send yourself a copy by using the “Send now” feature. Save the schedule, and Looker Studio will automatically generate and deliver the report according to the specified settings.
By leveraging the scheduling feature in Looker Studio, organizations can streamline their reporting processes, reduce manual effort, and ensure that critical information is delivered consistently and accurately. This not only enhances productivity but also enables stakeholders to stay informed and make data-driven decisions with confidence.
Charts & Visualizaitons in Looker Studio
Native Visualizations
Charts are a fundamental component of Google Looker Studio, enabling users to visualize data in a meaningful and interactive way. Looker Studio offers a variety of chart types, each designed to highlight different aspects of data and provide insights through visual representation. Understanding the available chart types and their best use cases can help users make the most of their data analysis.
Types of Charts
- Bar Charts
- Description: Bar charts represent data with rectangular bars, where the length of each bar is proportional to the value it represents.
- Use Cases: Ideal for comparing different categories or groups, such as sales figures across different regions or product categories.
- Line Charts
- Description: Line charts display data points connected by straight lines, typically used to show trends over time.
- Use Cases: Useful for tracking changes over periods, such as monthly revenue growth, stock prices, or website traffic.
- Pie Charts
- Description: Pie charts divide a circle into slices, where each slice represents a proportion of the whole.
- Use Cases: Effective for showing the composition of a dataset, like market share distribution or budget allocation.
- Area Charts
- Description: Area charts are similar to line charts but with the area below the line filled in.
- Use Cases: Good for displaying cumulative data and illustrating volume, such as total sales over time.
- Tables
- Description: Tables organize data in rows and columns, making it easy to read and compare individual data points.
- Use Cases: Best for detailed data presentation and when precise values are important, such as financial statements or inventory lists.
- Scatter Plots
- Description: Scatter plots show data points on a two-dimensional plane, revealing relationships between two variables.
- Use Cases: Ideal for identifying correlations, patterns, or outliers in datasets, such as sales vs. customer age.
- Combo Charts
- Description: Combo charts combine multiple chart types, typically bars and lines, to display different data series on the same chart.
- Use Cases: Useful for comparing different metrics in one view, such as revenue and profit margins.
- Geo Maps
- Description: Geo maps visualize data across geographical locations, using maps as the background.
- Use Cases: Best for spatial data analysis, such as regional sales distribution or population density.
- Scorecards
- Description: Scorecards display a single, key metric prominently.
- Use Cases: Ideal for highlighting important KPIs, such as total revenue, number of users, or conversion rates.
- Bullet Charts
- Description: Bullet charts compare a single measure against a goal or performance range.
- Use Cases: Useful for performance tracking, such as progress toward sales targets or budget adherence.
Customizing Charts
Looker Studio allows extensive customization of charts to meet specific visualization needs. Customization options include:
- Styling and Formatting
- Customize colors, fonts, and borders to align with branding or presentation standards.
- Adjust axis labels, legends, and titles for clarity and context.
- Interactivity
- Add filters, date range controls, and drill-down capabilities to make charts interactive and enable deeper data exploration.
- Data Handling
- Apply aggregations, such as sum, average, or count, to summarize data.
- Use calculated fields to create new metrics and dimensions based on existing data.
- Annotations and Reference Lines
- Add annotations to highlight important data points or events.
- Insert reference lines to mark target values or thresholds.
Best Practices for Using Charts
- Choose the Right Chart Type
- Select the chart type that best represents the data and the insights you want to convey. Avoid cluttering charts with too much information.
- Keep It Simple
- Aim for simplicity and clarity. Complex charts can be difficult to interpret and may obscure the key message.
- Use Consistent Scales
- Ensure that scales and axes are consistent across similar charts to facilitate comparison.
- Highlight Key Data
- Use colors and labels to highlight important data points, trends, or outliers.
- Test for Accuracy
- Regularly verify that charts are displaying data correctly and that any calculations or aggregations are accurate.
Community Visualizations in Looker Studio
 Community Visualizations in Google Looker Studio provide a powerful way to extend the platform’s visualization capabilities beyond the standard chart types. This feature allows users to create and share custom visualizations using JavaScript, HTML, and CSS, fostering a collaborative environment where developers can contribute unique and specialized visualizations to the community.
What Are Community Visualizations?
Community Visualizations are custom charts and visualizations created by users and developers that can be integrated into Looker Studio reports. These visualizations are built using open web technologies (JavaScript, HTML, CSS) and can be tailored to meet specific data visualization needs that are not covered by the native chart options.
Benefits of Community Visualizations
- Customization: Create highly specialized visualizations that fit specific business needs and data presentation requirements.
- Innovation: Leverage the creativity and expertise of the developer community to access a wide range of innovative visualizations.
- Flexibility: Adapt visualizations to match branding guidelines, user preferences, and unique data scenarios.
- Interactivity: Develop interactive visualizations that provide deeper insights and enhance user engagement.
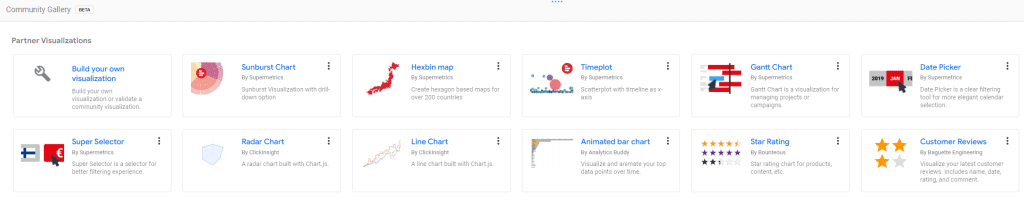
How to Use Community Visualizations
Using Community Visualizations in Looker Studio involves a few key steps:
- Enable Community Visualizations
- Navigate to the Looker Studio report where you want to add a community visualization.
- Click on the “Community Visualizations and Components” button (represented by a plus icon) in the chart menu.
- Enable community visualizations if prompted. This allows you to add custom visualizations to your report.
- Add a Community Visualization
- After enabling, click on the “Explore more” button within the community visualizations section.
- Browse through the available visualizations in the gallery, or search for specific types.
- Select the desired visualization and click “Add to report.”
- Configure the Visualization
- Once added to the report, configure the data source and settings for the visualization.
- Adjust properties such as data fields, dimensions, metrics, and any specific configuration options provided by the visualization.
- Customize and Style
- Use the provided customization options to style the visualization according to your needs. This may include changing colors, labels, tooltips, and other aesthetic elements.
Creating Your Own Community Visualization
For users with development skills, creating a custom community visualization involves the following steps:
- Set Up Your Development Environment
- Ensure you have a suitable code editor and knowledge of JavaScript, HTML, and CSS.
- Familiarize yourself with the Data Studio Community Visualization API documentation.
- Develop the Visualization
- Write the code for your visualization, defining how it should render data, handle user interactions, and adapt to different configurations.
- Use the provided API to interact with Looker Studio’s data and visualization framework.
- Deploy and Test
- Host your visualization code on a server that supports HTTPS.
- Test the visualization within Looker Studio to ensure it functions correctly and displays data as expected.
- Submit to the Community Gallery
- Once your visualization is ready and tested, you can submit it to the Looker Studio Community Gallery.
- Provide necessary metadata, documentation, and any usage instructions to help other users understand and implement your visualization.
Data Blends in Looker Studio
 Data blending is a powerful feature in Google Looker Studio that allows users to combine data from multiple sources into a single, unified view. This capability is essential for comprehensive data analysis, as it enables users to draw insights from diverse datasets without the need for complex data integration processes.
What is Data Blending?
Data blending involves merging data from different sources based on common fields. Unlike traditional data warehousing, which requires extensive ETL (Extract, Transform, Load) processes, data blending in Looker Studio is more flexible and can be performed directly within the platform. This allows for quick and dynamic analysis of disparate data sets.
Benefits of Data Blending
- Comprehensive Analysis: By combining data from multiple sources, users can gain a holistic view of their business performance.
- Time Efficiency: Eliminates the need for lengthy data integration processes, enabling faster insights.
- Flexibility: Allows users to create ad-hoc blends as needed, adapting to changing business requirements.
- Enhanced Insights: Enables the discovery of relationships and patterns that may not be apparent when analyzing data from a single source.
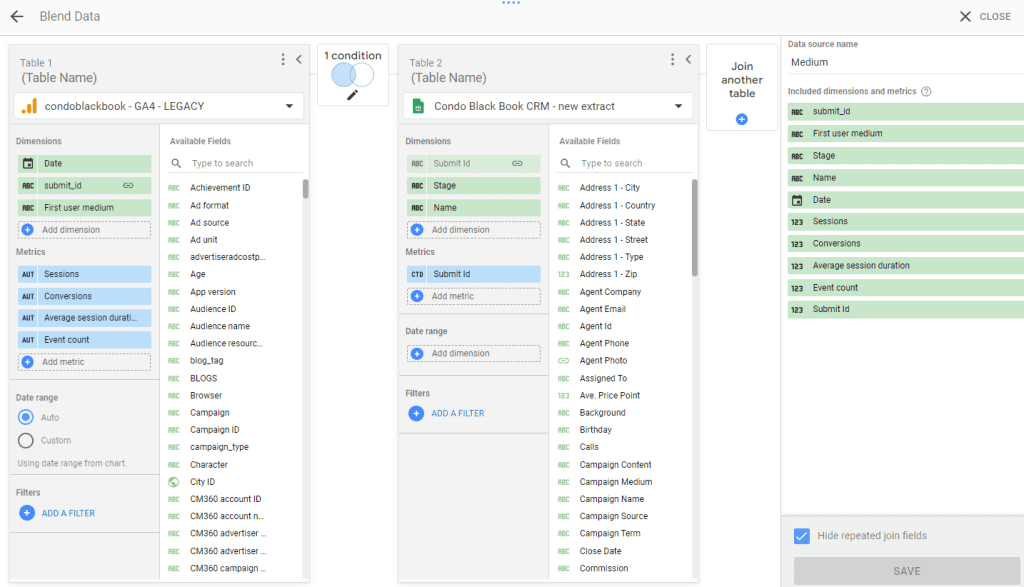
How to Create a Data Blend
Creating a data blend in Looker Studio involves several steps:
- Identify Common Fields
- Determine the common fields (keys) that will be used to join the data sources. These fields should have matching values to ensure accurate blending.
- Add Data Sources
- Open your Looker Studio report and add the data sources you want to blend. This can include Google Analytics, Google Sheets, BigQuery, and other partner or custom connectors.
- Create the Blend
- Go to the “Resource” menu and select “Manage blended data”.
- Click on “Add a blend” to start the blending process.
- Select the primary data source and the secondary data source.
- Choose the common fields from both data sources that will be used to join the data. This creates the relationship necessary for blending.
- Add the dimensions and metrics from each data source that you want to include in your blended data.
- Configure Join Settings
- Define the join type (left join, inner join, etc.) based on your analysis needs.
- Customize how the data is aggregated and presented.
- Use Blended Data in Visualizations
- Once the blend is created, it becomes available as a data source.
- Use this blended data source to build charts, tables, and other visualizations in your report.
Example of Data Blending
Consider a scenario where a marketing team wants to combine website traffic data from Google Analytics with sales data from a CRM system to analyze the effectiveness of their campaigns.
- Identify Common Fields: The common field could be the “Campaign ID” present in both Google Analytics and the CRM system.
- Add Data Sources: Add Google Analytics and the CRM system as data sources in Looker Studio.
- Create the Blend:
- Select Google Analytics as the primary data source and the CRM system as the secondary data source.
- Join on the “Campaign ID” field.
- Include dimensions such as “Date” and “Campaign Name” from Google Analytics, and “Sales Revenue” and “Number of Leads” from the CRM.
- Configure Join Settings: Choose a left join to ensure that all campaign data from Google Analytics is included, even if there are no corresponding sales in the CRM.
- Visualize: Use the blended data to create a time series chart that shows website visits and sales revenue over time, allowing the marketing team to assess the impact of their campaigns.
Best Practices for Data Blending
- Consistent Data Formatting: Ensure that the common fields used for blending are formatted consistently across all data sources.
- Validate Data Integrity: Regularly check for data integrity issues, such as missing or mismatched values, which can affect the accuracy of the blend.
- Optimize Performance: Be mindful of the size and complexity of the data being blended, as large datasets can impact performance. Aggregate data where possible to improve efficiency.
- Document Blends: Keep detailed documentation of your data blends, including the sources, common fields, and join types used. This helps maintain clarity and ease of use, especially for collaborative projects.
Data blending in Looker Studio is a versatile and efficient method for combining data from multiple sources, providing users with a comprehensive view of their business metrics. By leveraging this feature, organizations can enhance their data analysis capabilities, uncover deeper insights, and make more informed decisions. Whether blending marketing data with sales figures, financial data with operational metrics, or any other combination, Looker Studio’s data blending functionality empowers users to create powerful, integrated visualizations that drive strategic actions.
Filters in Looker Studio
 Filters are an essential feature in Google Looker Studio, allowing users to refine and focus their data analysis by including or excluding specific data points based on defined criteria. By using filters, users can customize their reports and visualizations to display only the most relevant information, making it easier to draw meaningful insights and make informed decisions.
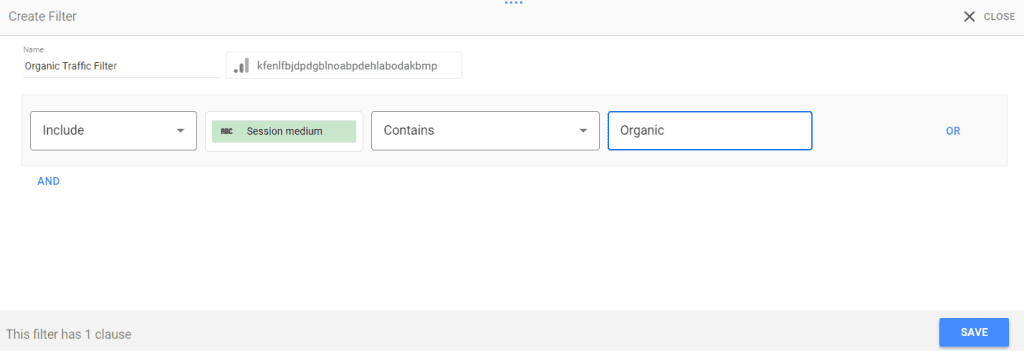
Looker Studio offers several types of filters to cater to different data filtering needs:
- Chart-Level Filters: Applied to individual charts or visualizations, these filters affect only the specific chart they are added to.
- Page-Level Filters: Applied to an entire page within a report, these filters affect all charts and visualizations on that page.
- Date Range Filters: Allow users to filter data based on a specific date range, enabling time-based analysis.
- Advanced Filters: Enable complex filtering conditions using multiple criteria and logical operators (AND, OR, NOT).
Filters in Looker Studio are a vital tool for tailoring data analysis to specific needs and focusing on the most relevant information. By effectively utilizing various types of filters, users can enhance their reports and visualizations, enabling more precise and actionable insights. Whether filtering data for detailed marketing analysis, sales performance evaluation, or time-based trends, Looker Studio’s filtering capabilities provide the flexibility and control needed to make informed, data-driven decisions.
Downloading Data from Looker Studio
Looker Studio provides a convenient way to download reports, allowing users to share insights easily and maintain offline records. Here are the steps and options available for downloading data from Looker Studio.
How to Download Looker Studio Data
 Formats and Options
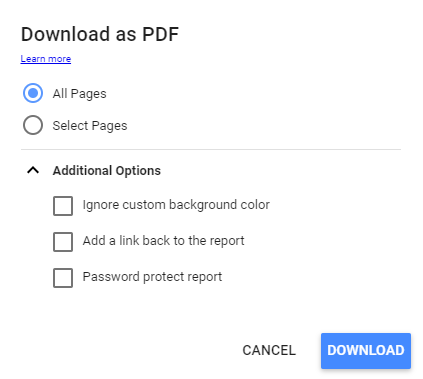
- PDF Format: Looker Studio data can be downloaded only as a PDF. Eventhough this format is widely used for sharing and printing reports especially with business stakeholders, it is not possibile to download CSV or XLS extractions with Google Looker Studio.
- Page Selection: You have the option to download all pages or select specific pages from the report.
- Additional Options:
- Ignore Custom Background Color: This option helps in maintaining readability and print quality by ignoring custom background colors.
- Add a Link Back to the Report: Embedding a link back to the report ensures that recipients can easily access the live report for the most up-to-date information.
- Password Protect Report: For added security, you can password protect the downloaded report to restrict unauthorized access.
Instructions for Downloading
Method 1: Using the Drop-Down Arrow Near the Share Button
- Open your Looker Studio report.
- Click on the drop-down arrow next to the Share button in the top-right corner.
- Select Download from the menu.
- Choose the desired options (e.g., all pages or specific pages, additional options like ignoring custom background colors).
- Click Download to save the report as a PDF.
Method 2: Inserting a Download Button on the Dashboard
- Open your Looker Studio report in edit mode.
- Insert a button on the dashboard by selecting the Button tool from the toolbar.
- Place the button in your desired location on the report.
- In the button’s properties, set the Button Action Type to Report Actions.
- Configure the action to Download Report.
- Customize the button’s appearance and label as needed.
- Save the report. Users can now click this button to download the report directly from the dashboard.
Preventing Unauthorized Copies of Dashboards
Importance of Maintaining Data Security
Maintaining data security is crucial for any organization. Ensuring that sensitive information is protected from unauthorized access and distribution helps prevent data breaches, intellectual property theft, and other security risks. In the context of Looker Studio, controlling who can download, print, or copy dashboards is essential to safeguarding your data and maintaining its integrity.
How to Limit Report Copying and Restrict Features
To restrict users from copying dashboards and prevent them from downloading and printing, follow these steps:
- Open Your Looker Studio Report:
- Navigate to the report you want to secure in Looker Studio.
- Access the Sharing Settings:
- Click on the Share button located in the top-right corner of the report interface.
- Configure Permissions:
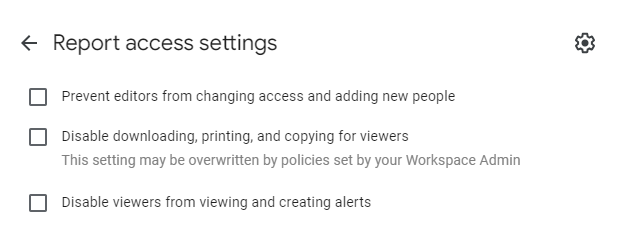
- In the sharing settings dialog, click on the gear icon (⚙) in the top-right corner of the window.
- Disable Downloading, Printing, and Copying:
- In the permissions settings, flag the option Disable downloading, printing, and copying for viewers.
By enabling this option, you can ensure that viewers cannot download, print, or make copies of the report, thereby maintaining better control over your data. This step is crucial for preventing unauthorized distribution of sensitive information and maintaining the security and confidentiality of your data assets.
Managing Users in Looker Studio
Effective user management in Looker Studio ensures that the right people have access to the right data, enhancing collaboration while maintaining data security. Here’s a guide on how to add, remove, and manage users, followed by best practices for user management.
How to Add, Remove, and Manage Users
Adding Users:
- Open the Report:
- Navigate to the Looker Studio report you want to manage.
- Access the Sharing Settings:
- Click on the Share button in the top-right corner of the report interface.
- Add Users:
- In the sharing settings dialog, enter the email addresses of the users you want to add in the “Add people” field.
- Select the appropriate permission level (Viewer, Editor, etc.) for each user.
- Click Send to invite the users. They will receive an email notification with access to the report.
Removing Users:
- Open the Report:
- Navigate to the Looker Studio report.
- Access the Sharing Settings:
- Click on the Share button in the top-right corner of the report interface.
- Manage Permissions:
- In the sharing settings dialog, find the list of current users with access to the report.
- Click on the drop-down arrow next to the user you want to remove.
- Select Remove to revoke their access.
Managing Users:
- Open the Report:
- Navigate to the Looker Studio report.
- Access the Sharing Settings:
- Click on the Share button in the top-right corner of the report interface.
- Update Permissions:
- In the sharing settings dialog, adjust the permissions for existing users as needed.
- You can change a user’s role from Viewer to Editor or vice versa by selecting the appropriate option from the drop-down menu next to their name.
Handling Data Credentials and Dashboard Handover
Managing data credentials and securely handing over dashboards in Looker Studio is essential for maintaining data integrity and continuity when transitioning responsibilities within your team or organization. This guide will walk you through the process of handling data credentials and performing a secure dashboard handover.
 Managing Data Credentials in Looker Studio
- Access Data Source Settings:
- Open your Looker Studio report and navigate to the Resources menu.
- Select Manage added data sources from the dropdown menu.
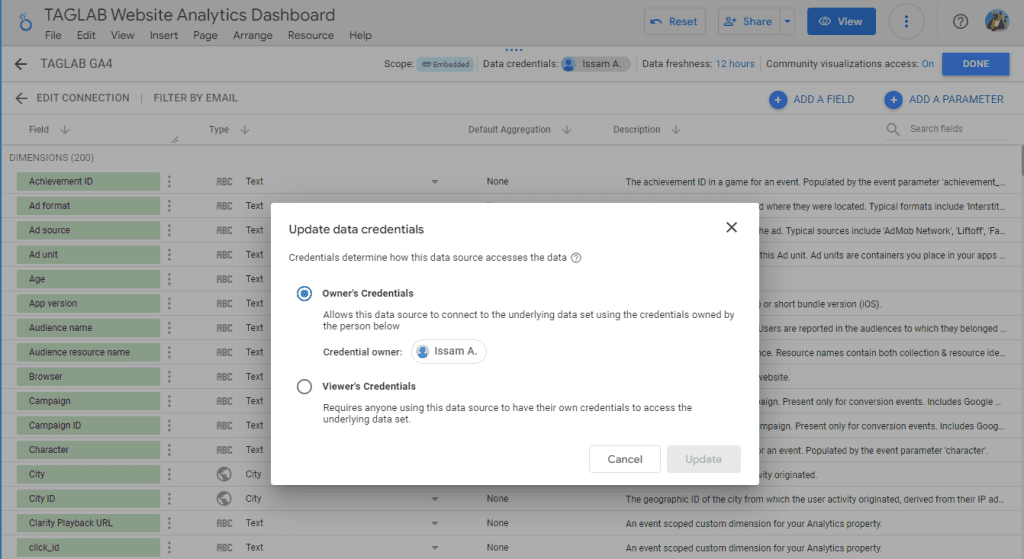
- Update Data Credentials:
- In the data sources list, find the data source you need to update.
- Click on the Edit button (pencil icon) next to the data source.
- Update the credentials as needed, ensuring that the new credentials have the necessary permissions to access the data.
- Set Credentials Sharing Settings:
- Within the data source settings, ensure that the correct credentials are used for data access.
- Looker Studio offers two options for credentials: Owner’s credentials and Viewer’s credentials.
- Owner’s credentials: Use this option to allow data access based on the data source owner’s permissions.
- Viewer’s credentials: Use this option to require each viewer to have their own access credentials.
- Test Data Access:
- After updating the credentials, test the data source to ensure that the data loads correctly and that all visualizations in the report are functioning as expected.
Handover Dashboard Securely
- Review Dashboard and Data Sources:
- Before handing over the dashboard, review all components, including data sources, visualizations, and filters, to ensure they are correctly configured and functioning.
- Share the Dashboard:
- Click on the Share button in the top-right corner of the report interface.
- Add the new owner’s email address in the “Add people” field, assigning them the appropriate permission level (typically Editor or Owner).
- Inform the new owner of the handover and provide any necessary context or instructions regarding the dashboard’s use.
- Transfer Ownership (if applicable):
- If you need to transfer full ownership of the report, click on the Share button and then select Manage access.
- Find the new owner in the list of users, click the drop-down arrow next to their name, and select Make owner.
- Confirm the ownership transfer.
- Document the Handover:
- Provide detailed documentation that includes:
- An overview of the dashboard’s purpose and key metrics.
- Instructions on how to access and update data sources.
- Any specific settings or configurations that the new owner needs to be aware of.
- Share this documentation with the new owner to ensure a smooth transition.
- Provide detailed documentation that includes:
- Communicate with the New Owner:
- Arrange a handover meeting or call with the new owner to walk them through the dashboard and answer any questions they might have.
- Ensure they understand how to manage data credentials, update the report, and troubleshoot common issues.
- Monitor the Transition:
- After the handover, monitor the transition period to ensure that the new owner is comfortable with the dashboard and can manage it effectively.
- Be available to provide support and address any issues that may arise during this time.
By following these steps, you can ensure that data credentials are handled securely and that dashboards are handed over smoothly, maintaining data integrity and continuity within your organization.
Conclusion
Google Looker Studio is an invaluable tool for organizations seeking to harness the power of their data through comprehensive reporting and insightful analytics. By leveraging its features, such as scheduling reports, downloading data, preventing unauthorized copies, managing users, and securely handling data credentials and dashboard handovers, businesses can streamline their data operations and ensure data security.
Effective data management and visualization are crucial for making informed decisions and maintaining a competitive edge in today’s fast-paced business environment. Looker Studio provides the flexibility and scalability needed to adapt to various data needs, making it a vital component of any data-driven strategy.
As organizations continue to evolve and grow, the ability to manage data efficiently and securely becomes increasingly important. By implementing best practices for user management and data security, and by utilizing the robust features of Looker Studio, businesses can not only enhance their data analytics capabilities but also foster a culture of data-driven decision-making.
In summary, mastering Google Looker Studio empowers organizations to unlock the full potential of their data, driving better insights, improved collaboration, and sustained business success.
Frequently Asked Questions
What is Google Looker Studio?
Google Looker Studio is a cloud-based business intelligence platform that allows users to explore, analyze, and share real-time business analytics. It integrates seamlessly with various data sources, including Google Analytics, BigQuery, and Google Cloud Storage, enabling users to create custom dashboards and reports.
How can I schedule reports in Looker Studio?
To schedule reports in Looker Studio, open your report, click on the Share button, and select the scheduling settings. Define the frequency and timing for report delivery, specify recipients, and choose the format. This automation ensures timely updates without manual intervention.
How do I download data from Looker Studio?
You can download data from Looker Studio by clicking the drop-down arrow near the Share button and selecting Download. You can choose to download all pages or specific pages and configure additional options like ignoring custom background colors or adding a link back to the report. Alternatively, you can insert a download button on the dashboard itself for easy access.
How can I prevent users from copying, downloading, or printing my Looker Studio dashboards?
To restrict users from copying, downloading, or printing your dashboards, click on the Share button, then click on the gear icon in the top-right corner of the sharing settings dialog. Flag the option “Disable downloading, printing, and copying for viewers” to enhance data security and control access.
How do I add, remove, and manage users in Looker Studio?
To manage users in Looker Studio, click the Share button on your report. To add users, enter their email addresses and assign appropriate permissions. To remove users, access the sharing settings, find the user, and select Remove. You can also update user roles by adjusting permissions in the sharing settings.
What are the best practices for managing users in Looker Studio?
Best practices for managing users in Looker Studio include assigning roles based on need, regularly reviewing access, using groups for large teams, setting expiration dates for temporary access, documenting access policies, and auditing user activity to ensure compliance with data security policies.
How can I handle data credentials and securely hand over a dashboard in Looker Studio?
To handle data credentials, update them in the data source settings and choose between using the owner’s or viewer’s credentials. For a secure dashboard handover, share the dashboard with the new owner, transfer ownership if needed, provide detailed documentation, and communicate with the new owner to ensure a smooth transition.
What types of data connectors are available in Looker Studio?
Looker Studio offers native connectors built by Google, such as Google Analytics and Google Ads, and partner connectors developed by third-party providers, such as Supermetrics and Funnel.io. These connectors help integrate data from various sources into Looker Studio for comprehensive analysis.
How do I build a custom data connector in Looker Studio?
To build a custom data connector, use Google Apps Script to write the necessary functions for authentication, configuration, schema definition, and data retrieval. Deploy the script as a web app, authorize it, and then add it as a data source in Looker Studio.
What is data blending in Looker Studio?
Data blending in Looker Studio involves combining data from multiple sources based on common fields. This enables comprehensive analysis and insights by merging disparate datasets into a unified view, without the need for complex ETL processes.