Your cart is currently empty!
Analytics Dashboard
Posted by:
|
On:
|
Detailed Explanation
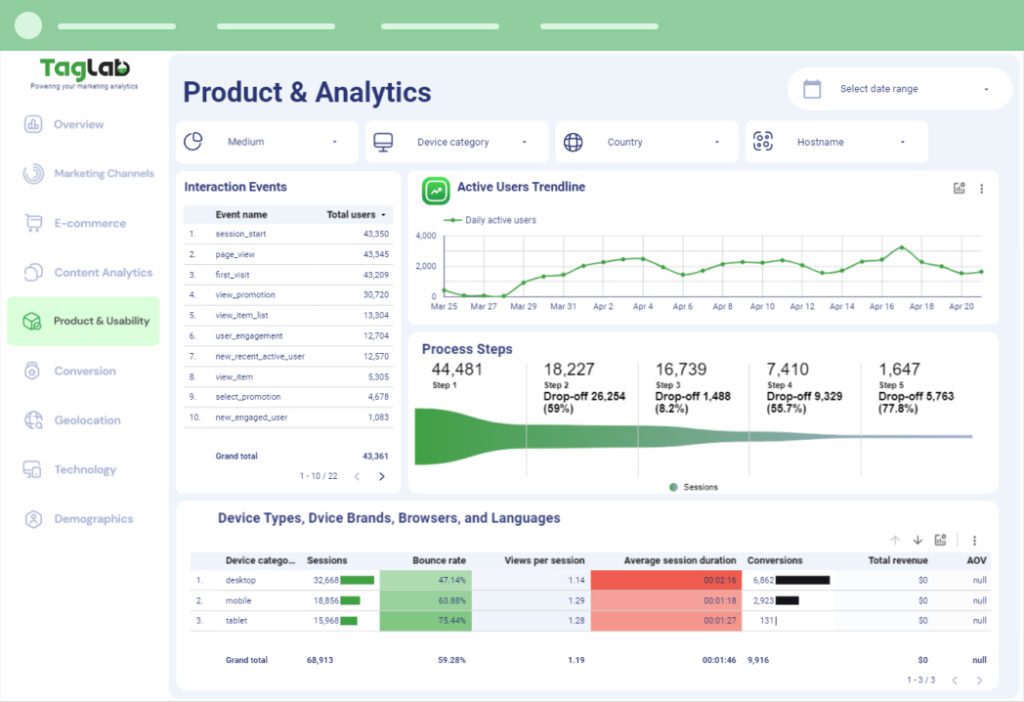
Analytics dashboards aggregate data from multiple sources and present it in an easily digestible format, typically utilizing charts, graphs, and tables. The key components of an analytics dashboard include:
- Data Visualization: Effective dashboards use various visualization techniques, such as bar charts, line graphs, pie charts, and heat maps, to represent complex data in a visually engaging manner. This helps users quickly identify trends, patterns, and anomalies.
- Key Performance Indicators (KPIs): Dashboards often feature KPIs that are relevant to the organization’s goals, such as sales figures, conversion rates, website traffic, and customer satisfaction scores. KPIs provide a snapshot of performance at a glance.
- Customization: Many analytics dashboards allow users to customize their views, selecting specific metrics, date ranges, and visualization types that align with their needs. This flexibility enables users to focus on the most relevant information.
- Real-Time Data: Dashboards can be designed to pull in real-time data from various sources, such as databases, web analytics tools, and CRM systems. This ensures that users are always viewing the most current information.
- User-Friendly Interface: An effective analytics dashboard is intuitive and easy to navigate, allowing users of all skill levels to access and interpret the data without requiring extensive training or technical knowledge.
Importance of Analytics Dashboards
Analytics dashboards are crucial for several reasons:
- Informed Decision-Making: By providing real-time access to data and insights, dashboards enable decision-makers to act swiftly and strategically, improving overall business agility.
- Performance Tracking: Dashboards allow organizations to continuously monitor performance against objectives, helping identify areas for improvement and growth opportunities.
- Enhanced Collaboration: Dashboards facilitate better communication and collaboration among team members by providing a shared view of metrics and goals, aligning efforts towards common objectives.
- Data-Driven Culture: By making data accessible and understandable, dashboards foster a culture of data-driven decision-making within organizations, encouraging stakeholders to rely on data rather than intuition.
Examples
- Marketing Analytics Dashboard: A dashboard that tracks digital marketing performance metrics, such as website traffic, conversion rates, social media engagement, and ROI from advertising campaigns.
- Sales Performance Dashboard: A dashboard used by sales teams to monitor key metrics like total sales, average deal size, sales pipeline stages, and sales forecasts, providing insights into team performance.
- Financial Dashboard: A dashboard that visualizes financial metrics, such as revenue, expenses, profit margins, and cash flow, allowing stakeholders to assess the organization’s financial health at a glance.
Related Terms
- Business Intelligence
- Data Visualization
- Key Performance Indicators (KPIs)
- Dashboard Software
- Data Analytics
Frequently Asked Questions
What is an Analytics Dashboard?
An Analytics Dashboard is a visual interface that consolidates and displays key performance indicators (KPIs), metrics, and data visualizations to provide a comprehensive view of an organization’s performance in real-time.
Why are Analytics Dashboards important?
Analytics Dashboards are important as they enable informed decision-making, track performance against objectives, enhance collaboration, and foster a data-driven culture within organizations.
What are the key components of an Analytics Dashboard?
Key components include data visualization techniques, key performance indicators (KPIs), customization options, real-time data access, and a user-friendly interface.
What are some examples of Analytics Dashboards?
Examples include marketing analytics dashboards that track digital performance, sales performance dashboards for monitoring sales metrics, and financial dashboards for visualizing financial health.