Your cart is currently empty!
Mastering Conversion Metrics for Succesfull Conversion Rate Optimization
Conversion rate optimization (CRO) is a critical aspect of digital marketing, focusing on improving the percentage of website visitors who complete desired actions. To effectively optimize conversion rates, marketers must delve into comprehensive reporting metrics beyond the basics. In this guide, we’ll explore essential reporting metrics for CRO and provide insights into how to interpret them effectively to drive better results.
User Engagement Metrics
User engagement metrics provide insights into how users interact with your website and content. Understanding these metrics is crucial for optimizing conversion rates.
- Time on Page: This metric measures the average amount of time users spend on a particular page. A high time on page indicates that users are engaged with your content, potentially leading to higher conversion rates.
- Pages per Session: Pages per session refer to the average number of pages users view during a single visit to your website. A higher pages per session value suggests that users are exploring multiple pages, indicating higher engagement and potentially higher conversion rates.
- Scroll Depth: Scroll depth measures how far users scroll down a page. It provides insights into whether users are consuming your content or bouncing off quickly. Analyzing scroll depth can help identify opportunities to optimize content layout and improve engagement.
Segmentation and Cohort Analysis
Segmentation and cohort analysis allow marketers to divide their audience into distinct groups based on various attributes such as demographics, behavior, or acquisition channel.
- Segmentation: By segmenting your audience, you can uncover patterns and behaviors that may not be apparent when looking at aggregate data. For example, segmenting users by geographic location or device type can reveal insights into which segments have the highest conversion rates and where optimizations are needed.
- Cohort Analysis: Cohort analysis involves tracking groups of users who share a common characteristic or experience within a defined time frame. This allows you to analyze how different cohorts behave over time and identify trends or changes in behavior that may impact conversion rates.
Conversion Funnel Analysis
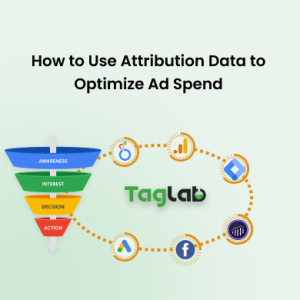
The conversion funnel is a visual representation of the stages that users go through before completing a conversion. Analyzing the conversion funnel can help identify potential drop-off points and optimize each stage of the user journey.
- Entrance Rate: Entrance rate measures the percentage of users who enter the conversion funnel at a particular stage. A high entrance rate indicates that many users are starting the conversion process at that stage, while a low entrance rate may suggest that users are dropping off earlier in the funnel.
- Conversion Rate by Stage: Conversion rate by stage measures the percentage of users who complete a desired action at each stage of the conversion funnel. Analyzing conversion rates by stage helps identify areas where users are converting successfully and where improvements can be made to optimize conversion rates.
- Exit Rate: Exit rate measures the percentage of users who exit the conversion funnel at a particular stage without completing the desired action. A high exit rate at a specific stage may indicate that users are encountering barriers to conversion, such as confusing navigation or lack of information.
Advanced Attribution Modeling
Attribution modeling is the process of assigning credit to marketing channels and touchpoints that contribute to conversions. Advanced attribution models offer insights into the contribution of each touchpoint along the customer journey.
- Linear Attribution: Linear attribution gives equal credit to each touchpoint along the customer journey. This model is useful for understanding the overall impact of marketing channels on conversions.
- Time Decay Attribution: Time decay attribution gives more credit to touchpoints that occur closer to the conversion event. This model recognizes the importance of touchpoints that influence users shortly before they convert.
- Position-Based Attribution: Position-based attribution gives more credit to the first and last touchpoints in the customer journey, while also considering the importance of touchpoints in between. This model acknowledges the role of both initial awareness and final conversion actions.
Data Visualization and Reporting Dashboards
Data visualization tools and reporting dashboards are essential for transforming raw data into actionable insights. These tools allow marketers to create visual representations of complex data sets, making it easier to identify trends, patterns, and outliers.
- Visualizing Conversion Funnels: Visualization tools can help marketers create visual representations of conversion funnels, allowing them to easily identify drop-off points and areas for optimization.
- Real-Time Monitoring: Reporting dashboards provide real-time insights into key metrics, allowing marketers to monitor performance and make informed decisions on the fly.
- Customized Reporting: Reporting dashboards can be customized to display specific metrics and KPIs relevant to CRO efforts, ensuring that marketers have access to the most relevant data for optimization.
Conclusion
Comprehensive reporting metrics are essential for optimizing conversion rates and driving better results in digital marketing. By exploring user engagement metrics, segmentation, cohort analysis, conversion funnel analysis, advanced attribution modeling, and utilizing data visualization and reporting dashboards, marketers can gain actionable insights into their campaigns and make informed decisions to improve conversion rates. Armed with these insights and strategies, marketers can optimize their marketing efforts, enhance user experiences, and achieve their business objectives with confidence.


