Your cart is currently empty!
How to Measure Content Performance on Your WordPress Blog with Google Analytics 4
Table of Contents
- Setting Up Google Analytics on WordPress
- Understanding Google Analytics for Content Measurement
- Understanding the Difference Between “Pages & Screens” and “Landing Pages” Reports in Google Analytics 4
- Setting Up and Analyzing Content Grouping in Google Analytics 4
- Relevant Metrics
- Pageviews
- Unique Visitors
- Setting Up Custom Dimensions in Google Analytics
- Creating a Looker Studio Dashboard for Content Performance Analysis
- Final Words
- Frequently Asked Questions
- What is content grouping in Google Analytics 4?
- How do I set up content grouping in Google Analytics 4?
- What metrics should I focus on when measuring content performance?
- How can I analyze the performance of grouped content in Google Analytics 4?
- Why is content grouping important for content performance analysis?
Measuring content performance on your WordPress blog is crucial for understanding what resonates with your audience, optimizing your content strategy, and driving traffic. This guide will walk you through the practical steps of setting up and using Google Analytics to track key metrics, including author names, publication dates, categories, and tags.
Setting Up Google Analytics on WordPress
Step-by-Step Installation Guide
To get started with Google Analytics on your WordPress blog, follow these steps:
- Create a Google Analytics Account: Sign up for a free account at analytics.google.com.
- Set Up a Property: Add your website as a new property in your Google Analytics account.
- Get Your Tracking ID: Copy the tracking ID provided by Google Analytics.
- Install a Plugin: Install and activate a plugin like MonsterInsights or Google Analytics for WordPress by Yoast.
- Configure the Plugin: Enter your tracking ID in the plugin settings and configure any additional options as needed.
Using Plugins
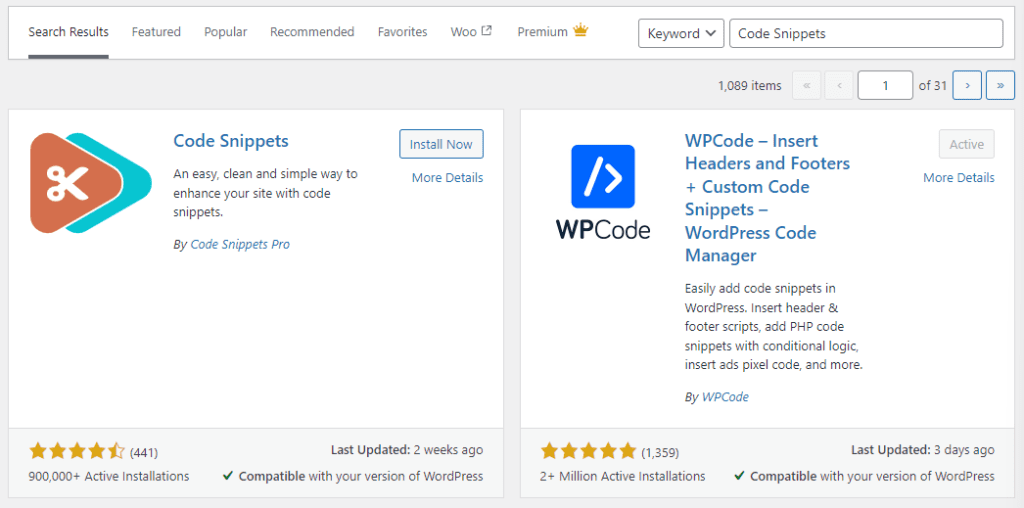 Plugins simplify the process of integrating Google Analytics with your WordPress site. Popular plugins like MonsterInsights offer user-friendly interfaces and additional features such as enhanced eCommerce tracking, event tracking, and custom dimensions.
For more details, refere to our full guide on setting up Google Analytics on WordPress.
Understanding Google Analytics for Content Measurement
 Overview of Key Features
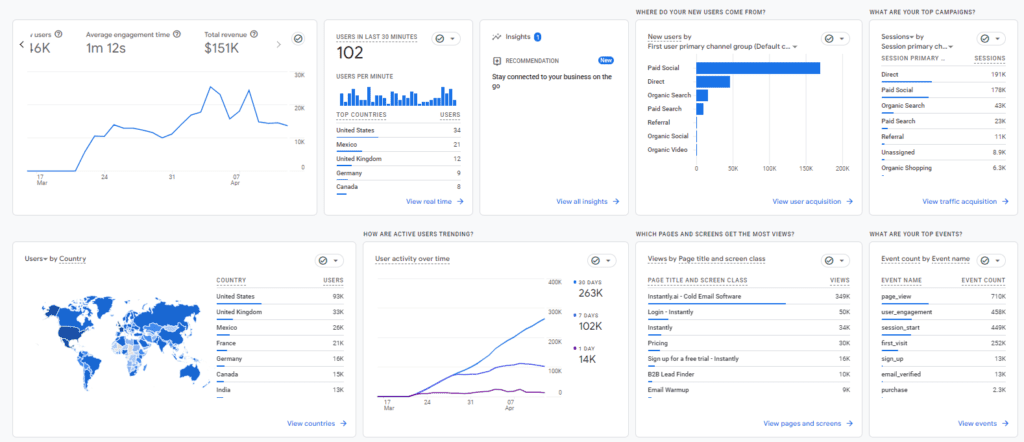
Google Analytics 4 (GA4) offers a comprehensive suite of reporting features that can significantly enhance your ability to measure and understand content performance on WordPress websites. Here are some key features and details on page reports:
Analyzing Acquisition Reports
Acquisition Reports reveal where your site’s traffic originates. This includes data from organic search, direct visits, social media, and paid campaigns. By analyzing these sources, you can determine which channels are most effective in driving visitors to your content. For instance, if a significant portion of traffic comes from social media, you might invest more in social media marketing.
Deep Dive into Behavior Reports
Behavior Reports are vital for understanding how visitors interact with your content. Here’s how you can use key metrics:
- Pageviews: Track the number of views for each page to identify popular content.
- Average Engagement Time: Measure how long users stay on a page, indicating the content’s effectiveness in retaining attention.
- Bounce Rate: A high bounce rate might suggest that visitors are not finding the content relevant or engaging, prompting a need for content optimization.
Leveraging Page Reports for Detailed Insights
Page Reports within the Behavior section offer granular data on individual pages:
- Top Pages: Identify which content pieces attract the most traffic in terms of views.
- Landing Pages: See the entry points of visitors, indicating which content draws them to your site and their potential journey performance afterwards.
Monitoring Conversion Reports
Conversion Reports track how well your content drives user actions. Set up goals such as form submissions, downloads, or purchases to measure content effectiveness. For instance, if you notice a high conversion rate from blog posts on a specific topic, you can create more content around that theme to drive further engagement.
Practical Steps for Measuring Content Performance
- Set Clear Goals: Define what success looks like, whether it’s increased pageviews, lower bounce rates, or higher conversions.
- Track Key Metrics: Use GA4 to monitor metrics that align with your goals.
- Analyze Data Regularly: Regularly review your GA4 reports to identify trends and make data-driven decisions.
- Optimize Based on Insights: Use the data to refine your content strategy, focusing on what works and improving what doesn’t.
Understanding the Difference Between “Pages & Screens” and “Landing Pages” Reports in Google Analytics 4
When analyzing content performance on your WordPress site with Google Analytics 4 (GA4), it’s essential to understand the distinctions between the “Pages & Screens” and “Landing Pages” reports. Both provide valuable insights but focus on different aspects of user interaction with your content.
Pages & Screens Reports
The Pages & Screens report in GA4 provides a comprehensive view of how users interact with individual pages and screens on your site or app. This report includes detailed metrics that help you understand overall content performance:
- Pageviews: The total number of times a page or screen was viewed.
- User Engagement: Metrics such as average engagement time per session, which shows how long users are interacting with each page.
- Event Counts: The number of specific events (like clicks or form submissions) that occurred on each page.
- Views per User: The average number of times a page is viewed by an individual user, indicating repeat engagement.
The Pages & Screens report is ideal for getting a holistic view of how all pages on your site perform and how users interact with your content over multiple visits.
Landing Pages Reports
The Landing Pages report focuses specifically on the first pages users see when they enter your site. These entry points are critical for understanding initial user engagement and the effectiveness of your marketing efforts:
- Sessions: The number of sessions that began on each landing page, indicating which pages are most effective at attracting users.
- New Users: The count of first-time visitors starting their session on each landing page, helping you understand how well you are acquiring new users.
- Bounce Rate: The percentage of sessions that began and ended on the same page without further interaction, highlighting the initial engagement quality.
- Conversions: The number of goal completions that started from each landing page, showing how effectively these pages drive desired actions.
The Landing Pages report is crucial for assessing the performance of your site’s entry points, understanding where your audience first interacts with your content, and optimizing these pages to enhance user experience and drive conversions.
Key Differences
- Focus Area:
- Pages & Screens: Provides a broad view of user interactions across all pages and screens, focusing on overall engagement and behavior.
- Landing Pages: Concentrates on the first page users visit, emphasizing initial engagement and the effectiveness of entry points.
- Metrics and Insights:
- Pages & Screens: Includes metrics like pageviews, engagement time, and event counts for all pages.
- Landing Pages: Includes metrics like sessions, new users, bounce rate, and conversions for entry pages.
- Use Cases:
- Pages & Screens: Ideal for understanding overall content performance and user behavior on individual pages throughout their journey.
- Landing Pages: Essential for analyzing the effectiveness of your marketing efforts and the initial user experience.
By leveraging both reports, you can gain a comprehensive understanding of your content performance on WordPress, from initial user entry to overall engagement and behavior across your site. For more detailed insights on setting up GA4 and utilizing these reports, check out our GA4 setup guide and event tracking strategies.
Setting Up and Analyzing Content Grouping in Google Analytics 4
Content grouping in Google Analytics 4 (GA4) allows you to organize your content into logical groups for easier analysis. This can be particularly useful for understanding performance across different categories, authors, or topics on your WordPress site. Here’s a detailed guide on how to set it up and analyze grouped content performance.
Implement Content Grouping Logic for Google Analytics 4
Next, you need to pass the content grouping information to GA4 using Google Tag Manager (GTM).
- Create Variables in GTM:
- Content Category: Create a variable in GTM that captures the content category. This could be from a data layer variable or by extracting part of the URL or a meta tag.
- Author: Similarly, create a variable for the author name.
- Configure GA4 Tag to Include Custom Dimensions:
- In GTM, go to your GA4 configuration tag or create a new GA4 event tag.
- In the tag configuration, click on “Fields to Set” and add the custom dimensions you created.
- Map the variables you created to these custom dimensions. For example:
content_category-> {{Content Category Variable}}author-> {{Author Variable}}
- Publish the Container: Once you have set up your variables and configured your GA4 tags, publish the GTM container to apply these changes to your site.
Analyzing Grouped Content Performance
With content grouping set up, you can analyze the performance of your grouped content in GA4.
- Navigate to Reports: In GA4, go to the “Reports” section.
- Engagement Reports: Under “Engagement,” select “Pages and Screens” to view performance data.
- Apply Custom Dimensions: Use the custom dimensions you set up for content grouping to filter and compare data.
Viewing Grouped Content Data
- By Category: Apply the “Content Category” custom dimension to see which categories of content are most popular and engaging.
- By Author: Apply the “Author” custom dimension to analyze performance based on the author, helping you identify which authors are driving the most traffic and engagement.
- Other Criteria: Use additional custom dimensions relevant to your content strategy, such as publication date or content type, to gain deeper insights.
Benefits of Content Grouping
- Simplified Analysis: Content grouping makes it easier to identify trends and performance across different segments.
- Actionable Insights: Understand how different content groups perform and make informed decisions to optimize your content strategy.
- Enhanced Reporting: Provides a clearer picture of overall site performance, allowing for better reporting and strategic planning.
Relevant Metrics
When measuring content performance on your WordPress site, focusing on relevant metrics is crucial for gaining actionable insights. Google Analytics 4 (GA4) provides a range of metrics to help you understand how users interact with your content. Here’s a detailed look at these metrics and how to set up custom dimensions for more in-depth analysis.
Pageviews
Pageviews represent the total number of times a page is viewed. This metric helps you identify the popularity of specific content and track overall engagement trends on your site.
Unique Visitors
- Unique Visitors: refer to the number of individual users who visit your site. This metric gives you an idea of your reach and how many distinct users are consuming your content.
- Session Duration: is the average amount of time users spend on your site during a session. Longer session durations typically indicate more engaging content.
- Bounce Rate: is the percentage of visitors who leave your site after viewing only one page. A high bounce rate may suggest that your landing pages are not engaging enough or that the content does not meet user expectations.
- Scroll Rate: measures how far down a page users scroll. This metric helps you understand whether visitors are consuming your entire content or if they drop off before reaching the end.
- Time on Page: indicates the average amount of time users spend on a specific page. This metric helps you assess the engagement level of individual pages.
Tracking Basic Traffic Metrics
Basic traffic metrics such as Pageviews, Unique Visitors, and Session Duration provide a snapshot of your site’s overall performance. To view these metrics in GA4, navigate to the Behavior section and explore the Site Content reports. Here’s how:
- Go to Reports: In GA4, navigate to the “Reports” section on the left-hand menu.
- Behavior Overview: Select the “Engagement” tab and then “Pages and Screens” to view detailed metrics on user interactions.
- Site Content Reports: Explore the different reports available under “Engagement” to analyze pageviews, unique visitors, and session duration.
Setting Up Custom Dimensions in Google Analytics
Custom dimensions allow you to track additional information that is not included in standard Google Analytics reports. This can provide deeper insights into your content performance. Here’s a step-by-step guide to creating custom dimensions:
- Go to Admin Settings: In Google Analytics, navigate to the Admin section by clicking the gear icon at the bottom left of the interface.
- Create Custom Dimensions: Under the Property column, select “Custom Definitions” and then “Custom Dimensions.” Click the “New Custom Dimension” button.
- Name and Scope: Name your custom dimension (e.g., “Author Name”) and set the scope. GA4 offers different scope options (Event, User, Session). For tracking specific attributes like author names, use the “Event” scope.
- Implement on Site: After creating the custom dimension, implement it on your site using Google Tag Manager or directly in your site’s code. Ensure the custom dimension is included in the data layer so it can be sent to GA4 with relevant events.
Tracking Author Names as Custom Dimensions
How to Implement
To track author names, you need to add code to your WordPress theme. Use the following code snippet in your functions.php file:
Analyzing Author Performance
Once implemented, you can analyze author performance by creating a custom report in Google Analytics that includes the Author Name dimension.
Tracking Article Publication Dates
Setting Up Publication Date Tracking
To track publication dates, add another custom dimension and use the following code:
function set_publication_date_custom_dimension() {
if (is_single()) {
$pub_date = get_the_date('Y-m-d');
echo "";
}
}
add_action('wp_head', 'set_publication_date_custom_dimension');
Classifying Articles into Categories and Tags
Implementing Category and Tag Tracking
Create custom dimensions for categories and tags, then use this code:
function set_category_tag_custom_dimensions() {
if (is_single()) {
$category = get_the_category();
$tag = get_the_tags();
echo "";
}
}
add_action('wp_head', 'set_category_tag_custom_dimensions');
Creating a Looker Studio Dashboard for Content Performance Analysis
To elevate your content performance analysis, consider creating a Looker Studio dashboard. This platform allows you to visualize your data from Google Analytics 4 and other sources in a centralized and interactive way.
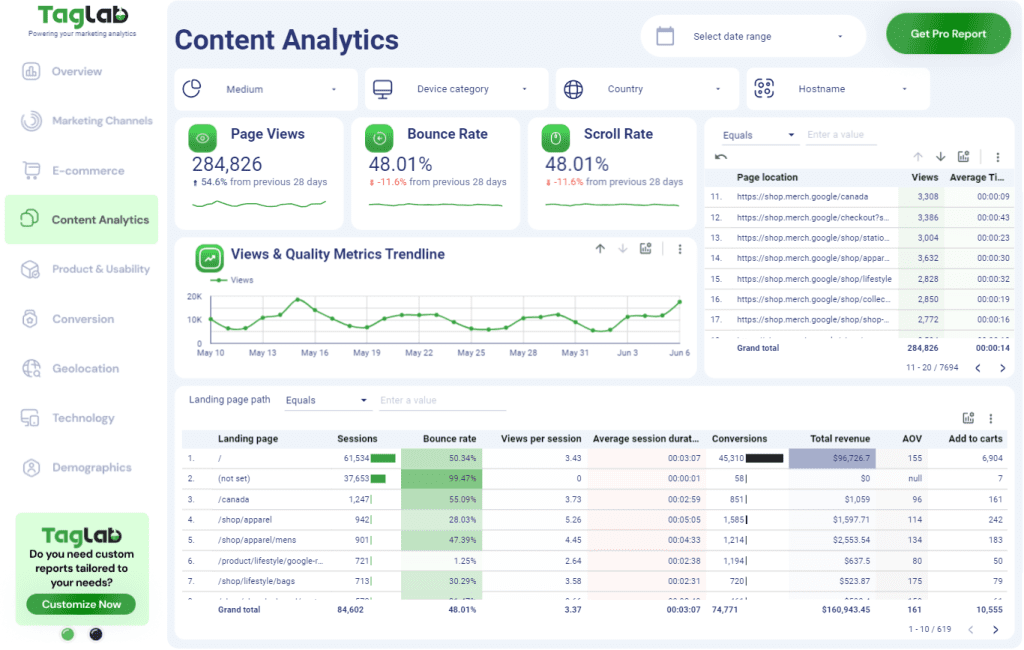 You can get a free copy of out content analytics dashboard for Google Analytics and Looker Studio here.
Benefits of a Looker Studio Dashboard
A Looker Studio dashboard provides centralized data visualization, customizable reports, interactive elements, and automated reporting, making it easier to monitor and analyze your content performance.
Setting Up Your Looker Studio Dashboard
Step 1: Connect Data Sources
First, open Looker Studio and sign in with your Google account. Create a new report by clicking on the “+” button. Then, add your data sources by selecting “Add Data” and choosing Google Analytics to connect your GA4 property. You can also add other sources like Google Sheets, Google Ads, or CSV files.
Step 2: Design Your Dashboard
Set up the layout by organizing your dashboard into sections for different types of analysis, such as an overview, detailed metrics, and comparisons. Add charts, tables, and scorecards to display key metrics like pageviews, unique visitors, session duration, bounce rate, scroll rate, and time on page. For instance, create an overview section with scorecards for high-level metrics and a content performance section with tables and bar charts showing performance by content category or author.
Step 3: Customize Visualizations
Customize your visualizations by applying filters and segments to segment data by date range, device type, traffic source, or custom dimensions like content category and author. Use interactive controls, such as date range selectors and dropdown filters, to make your dashboard user-friendly and interactive.
By setting up a Looker Studio dashboard, you can gain deeper insights into your content performance and make data-driven decisions to optimize your WordPress site.
Final Words
In conclusion, mastering the use of Google Analytics 4 to measure content performance on your WordPress site is a game-changer. By setting up and effectively utilizing custom dimensions and content groupings, you gain invaluable insights that go beyond basic metrics. This approach empowers you to understand not just how much traffic your content is receiving, but also how different segments are performing and why.
Implementing these strategies allows you to make data-driven decisions that enhance user engagement, optimize content strategies, and ultimately achieve your site’s goals. Regularly reviewing these insights ensures you stay ahead of trends and continuously improve your content’s effectiveness.
Frequently Asked Questions
What is content grouping in Google Analytics 4?
Content grouping in Google Analytics 4 allows you to categorize your content into logical groups such as by category, author, or content type. This helps in analyzing and understanding the performance of different segments of your content, making it easier to identify trends and optimize your content strategy.
How do I set up content grouping in Google Analytics 4?
To set up content grouping in Google Analytics 4, you need to create custom dimensions in the Admin section under Custom Definitions. Then, use Google Tag Manager to capture the necessary data and pass it to GA4 as custom dimensions. Finally, configure your GA4 tags to include these custom dimensions and publish the changes.
What metrics should I focus on when measuring content performance?
When measuring content performance, focus on metrics such as pageviews, unique visitors, session duration, bounce rate, scroll rate, and time on page. These metrics provide a comprehensive view of how users interact with your content and help identify areas for improvement.
How can I analyze the performance of grouped content in Google Analytics 4?
To analyze the performance of grouped content in Google Analytics 4, navigate to the Reports section and select Engagement under Pages and Screens. Apply your custom dimensions to filter and compare data based on your content groups, such as categories or authors, to gain deeper insights into their performance.
Why is content grouping important for content performance analysis?
Content grouping is important because it simplifies the analysis process, allowing you to identify trends and performance across different content segments easily. It helps you make informed decisions to optimize your content strategy and enhances reporting by providing a clearer picture of overall site performance.