Your cart is currently empty!


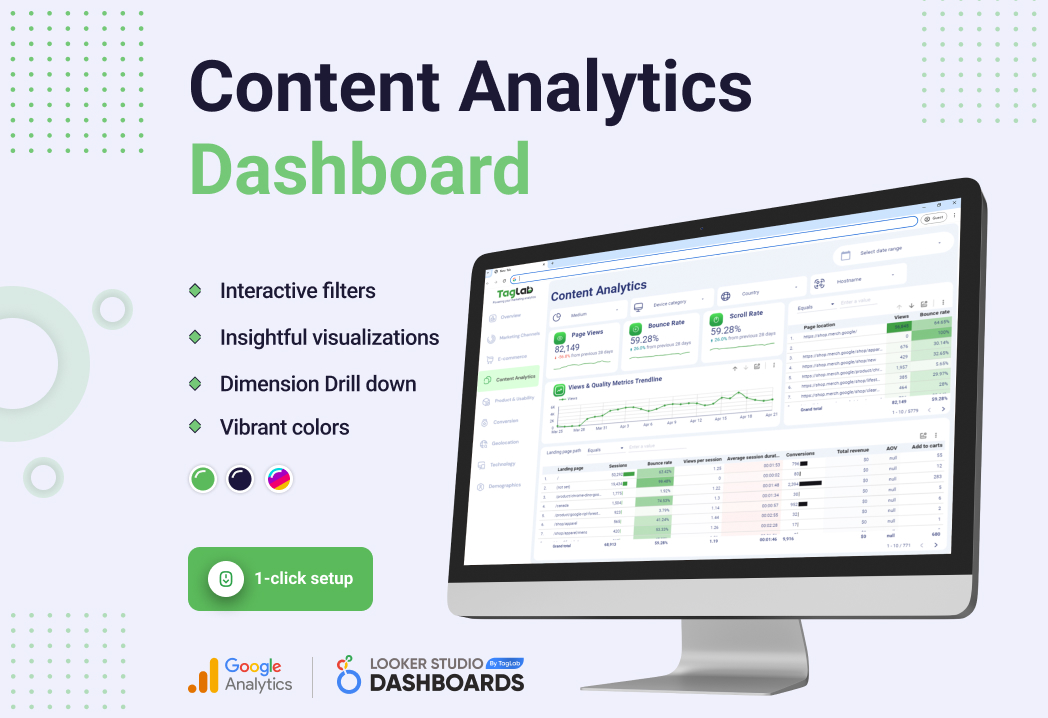
Content Analytics Metrics Dashboard
$0.00
Refine your content strategy using TagLab’s Content Analytics Dashboard, a Looker Studio tool that tracks page performance metrics like views, bounce rates, and engagement.
Dashboard Specs
- Fully interactive dashboard with Google Analytics Data for Marketing KPIs
- 1 Click plug-in
- 2 Marketing KPI report Pages: Overview & E-commerce Metrics
- Drill down and filter by dimensions (Item Name > Item ID> Item Category > Item Variant > Item Brand or Transaction ID >Order Coupon)
- 3 KPI scorecards
- Conversion Funnel Steps
- Trendline by Several Metrics (Total Revenue, E-commerce Purchases, Add to carts, Checkouts Started, Items checked out, Item View events, Conversion Rate)
- Dropdown filters by date, medium, device category, country, and website hostname
- Custom sorting and report export
TagLab’s Content Analytics Dashboard in Looker Studio brings clarity to your content’s performance. It reveals how users interact with your pages through detailed metrics such as page views, bounce rates, and scroll rates. With changes over the previous period clearly indicated, you can quickly identify trends and adjust your content strategy accordingly.
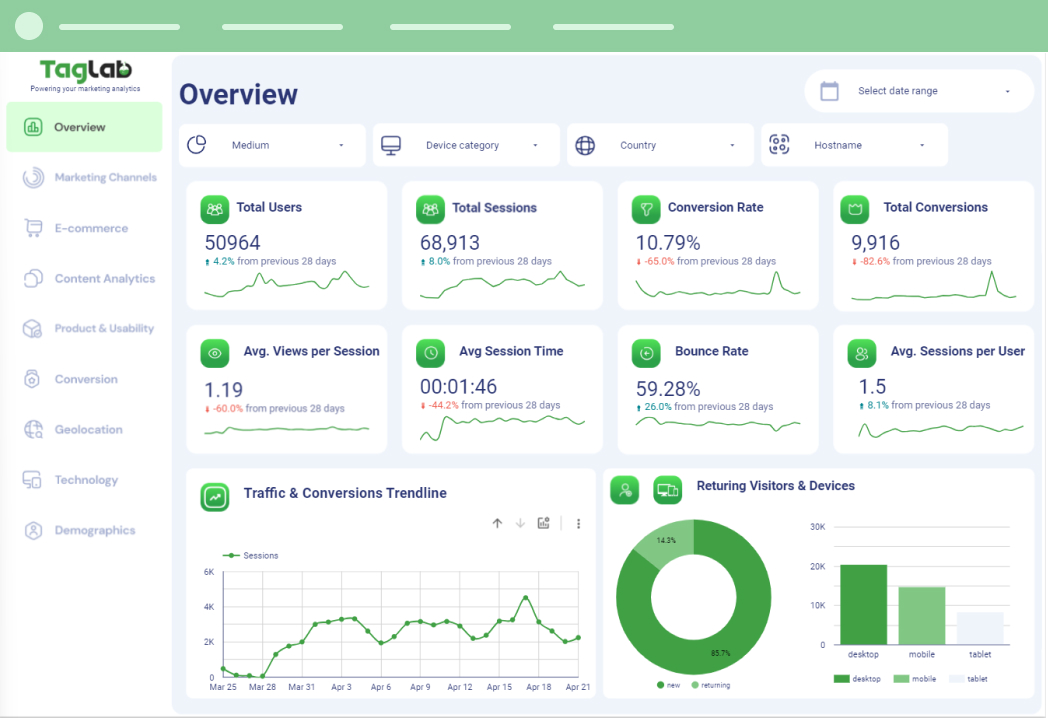
Overview Report (Page 1)
Consolidated Marketing Health A dashboard summary that gives a snapshot of total users, sessions, conversion rates, and other key metrics to quickly assess the overall health and effectiveness of your marketing efforts.
Each dashboard is designed to be interactive and customizable, giving you the power to focus on what matters most to your business. With TagLab, you are equipped to make data-driven decisions that can lead to improved user experiences and enhanced marketing ROI.
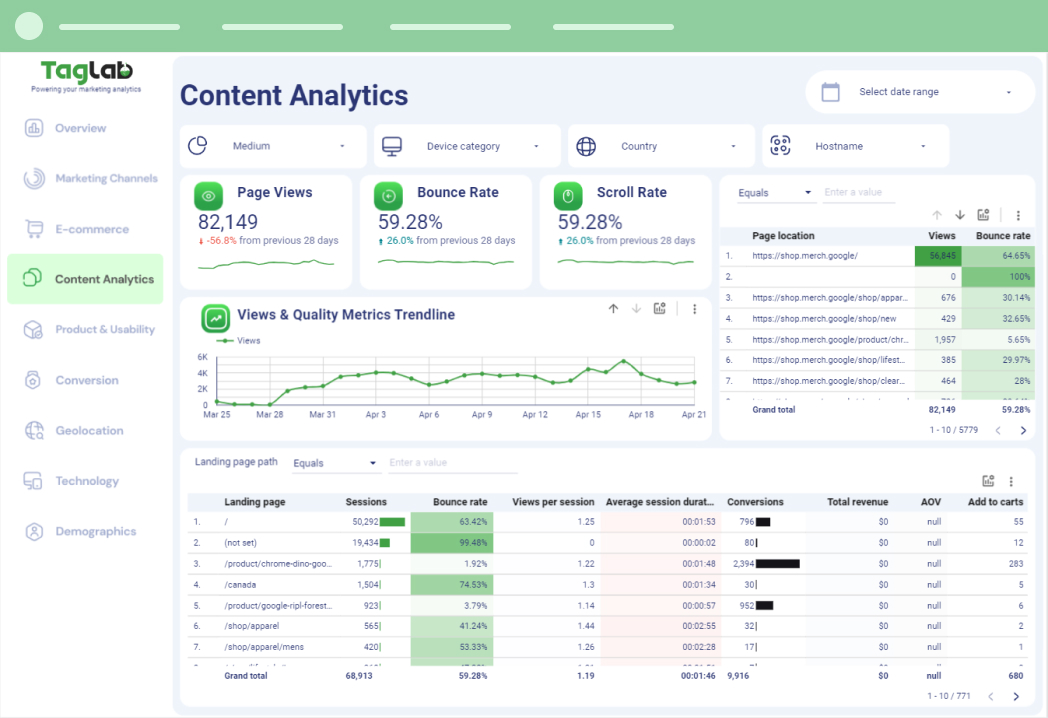
Content Analytics Report (Page 2)
The dashboard is meticulously designed to measure the impact and quality of your content. It provides a Views & Quality Metrics Trendline for visual tracking of engagement over time. The detailed session data, bounce rates, and conversion information for individual landing pages enable you to pinpoint which content keeps users interested and which might require optimization for better retention and conversion.
| Visualization Platform | Google Looker Studio |
|---|---|
| Data Source | Google Analytics 4 |
| Connector Type | Google Native Free Connector |
| Basic Metrics Requirements | This dashboard requires Google Analytics 4 tracking code running your website for most of the basic metrics (Visits, Users, Views, Geolocation etc..) |
| E-commerce Requirements | This template requires Google Analytics 4 Ecommerce implementation to be in place to display e-commerce metrics such as purchases, transactions, revenue, add to cart, and product metrics. |
| Custom Events Requirements | Custom events and their parameters, relevant for your business must be implemented on your website or mobile application |
| Dashboard Personalization Requirements | Only e-commerce events will work out of the box in this dashboard if implemented. Other custom events might need a minor tweaking of the dashboard to display properly. |
| Other Info | We provide full dashboard configuration and adaptation support. |
Related products
-

Geolocation, Technology & Demographics KPIs Dashboard
$0.00 -
Conversions & Product Usability KPIs Dashboard
$0.00 -
E-commerce Analytics Metrics Dashboard
$0.00 -
KPI Overview and Marketing Channels Dashboard Template
$0.00 -
Marketing Analytics Full KPI Framework Dashboard Template
$0.00


