Your cart is currently empty!
Mastering Marketing KPIs with Looker Studio and Google Analytics 4
Table of Contents
- The Synergy of Looker Studio and GA4 for KPI Tracking
- Core Marketing KPIs Visualized in Looker Studio
- Designing Looker Studio Dashboards for Marketing Efficiency
- Actionable Marketing Insights from Looker Studio Reports
- Addressing Advertising and Conversion Rate Optimization
- Final Words
- Frequently Asked Questions about Marketing KPIs and Looker Studio
- What are marketing KPIs and why are they important?
- How does Looker Studio help in tracking marketing KPIs?
- Can I connect Looker Studio directly to Google Analytics 4?
- What are some essential marketing KPIs to track in Looker Studio?
- How can I customize my dashboard in Looker Studio for better insights?
- What are the advantages of using GA4 with Looker Studio for KPI management?
- Are there any best practices for designing effective marketing dashboards in Looker Studio?
Key Performance Indicators (KPIs) are specific metrics that, when tracked and analyzed correctly, can provide a clear picture of the effectiveness of marketing strategies. They help in setting objectives, evaluating progress, and adjusting tactics to maximize results.
Understanding and monitoring the right KPIs is pivotal to any marketing campaign’s success. However, the challenge often lies in the interpretation and visualization of these metrics. This is where Looker Studio comes into the picture. As a powerful data visualization tool, Looker Studio transforms the complexities of raw data into clear, insightful dashboards that are easy to interpret.
 Integrating Looker Studio with Google Analytics 4 (GA4) allows marketers to tap into a comprehensive analytics suite that’s built for the modern web landscape. GA4’s user-centric measurement model not only respects user privacy but also adapts to a cookie-less future, providing robust, actionable insights.
This article will guide you through the process of utilizing Looker Studio in tandem with GA4 to select, visualize, and analyze the KPIs that matter most to your marketing efforts. From setup to customization, we’ll explore how to craft a Looker Studio dashboard that acts as a beacon of insight, guiding your marketing decisions towards measurable success.
The Synergy of Looker Studio and GA4 for KPI Tracking
Integrating Looker Studio with Google Analytics 4 (GA4) is akin to connecting the dots between data collection and data storytelling. GA4 provides a wealth of information through its metrics and dimensions, while Looker Studio offers the canvas where the story of your data unfolds.
Looker Studio’s Integration with GA4: A Match for Modern Marketing
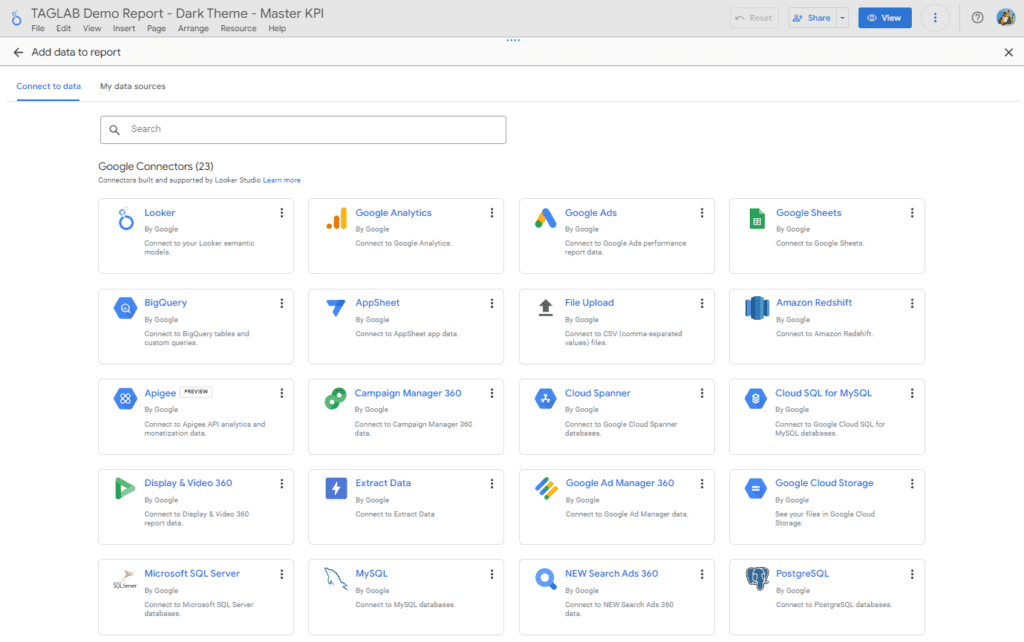 Looker Studio’s integration with GA4 and any other Google product such as Google Ads, Search Console, or BigQuery is seamless, empowering marketers to import their GA4 data directly into Looker Studio’s interactive dashboards. This synergy allows for a more nuanced approach to KPI tracking and analysis. With GA4’s focus on events and user properties over sessions and pageviews, marketers can dive deeper into user interactions and the success of specific marketing initiatives.
Read more on Event Tracking in GA4: Best Practices and Advanced Strategies.
Real-Time Analysis and Reporting
In today’s fast-paced digital landscape, the ability to access real-time data can be the difference between capitalizing on a trend and missing the boat. Looker Studio provides real-time reporting capabilities enable marketers to make swift decisions, adjusting campaigns on the fly to optimize performance, by eliminating procedural layers of data extraction and elaboration.
A Holistic View of the Customer Journey
GA4’s user-centric approach provides a view of the customer journey across multiple devices and platforms. GA4 is one of the best tools when it comes to lead generation and e-commerce businesses. When this data is visualized through Looker Studio, marketers can understand not just when conversions are happening, but also how users are interacting with every touchpoint along their path to purchase.
Benefits of Using Looker Studio Dashboards
- Customizable Interfaces: Marketers can tailor their dashboards to highlight the KPIs that are most relevant to their business objectives, whether it’s user acquisition, engagement, conversion, or retention.
- Collaboration and Sharing: Looker Studio’s collaborative features ensure that insights can be shared across teams, making it a pivotal tool for aligning marketing efforts with overall business strategy.
- Data Accessibility: By breaking down data silos, Looker Studio makes analytics accessible to non-technical marketers, enabling a data-informed culture within the organization.
Navigating the Shift from Universal Analytics to GA4: With the advent of GA4 as the new standard for Google Analytics, marketers had to transition from Universal Analytics popular interface to this more advanced, data collection tool with less data visualization capabilities. Looker Studio facilitated this transition by providing familiar visualization tools to work with GA4’s new measurement paradigm.
In summary, the combination of Looker Studio and GA4 equips marketers with a sophisticated, yet user-friendly platform to track and analyze their marketing KPIs effectively. This union not only simplifies the complex data landscape but also enhances the strategic decision-making process through detailed, insightful visualizations.
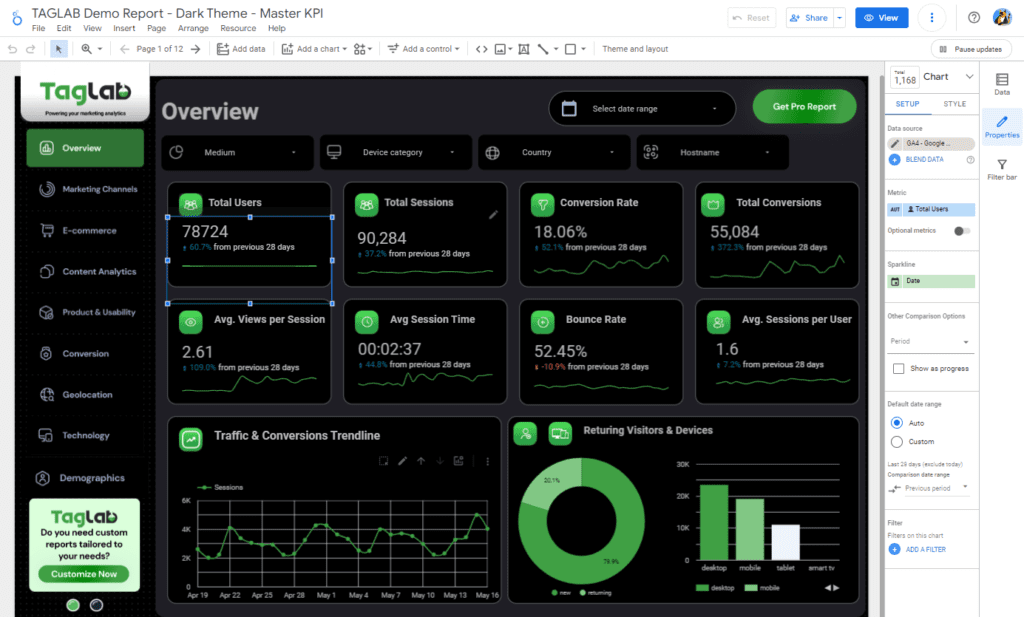
Core Marketing KPIs Visualized in Looker Studio
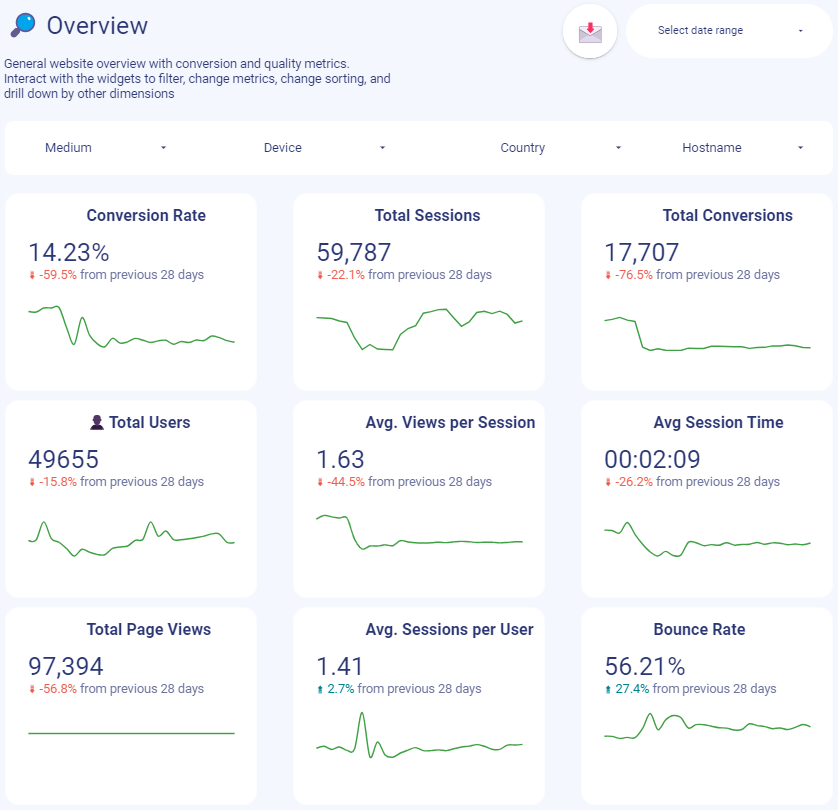
The effectiveness of a marketing strategy is often judged by its KPIs. Looker Studio excels in visualizing these indicators, offering marketers insightful dashboards that turn data into decisions. Here’s how Looker Studio can display key marketing KPIs drawn from GA4.
1. Traffic Acquisition KPIs
- Sessions and Users: Visualized through line charts to track trends over time.
- Source/Medium: Pie charts and tables illustrate the breakdown of traffic sources, highlighting which channels bring in the most visitors.
2. Engagement KPIs
- Pages/Session and Average Session Duration: Bar graphs compare engagement across different campaigns or time periods.
- Bounce Rate: A color-coded heat map can show at a glance which pages retain users and which ones don’t.
3. Conversion KPIs
- Conversion Rate: Funnel visualizations map the customer journey, from initial contact to conversion.
- E-commerce Conversion Rate: Combine tables and line graphs to correlate conversion rates with specific products or categories.
4. Customer Retention KPIs
- Repeat Visitors: Use a segmented bar chart to differentiate new from returning users.
- Daily, Weekly, and Monthly Active Users (DAU/WAU/MAU): Line or area charts to show engagement levels and retention over time, indicating the stickiness of the website or app.
Best Practices for KPI Visualization in Looker Studio
- Simplicity is Key: Ensure your dashboard is not cluttered. Display only the KPIs that directly impact decision-making.
- Consistency in Design: Use a consistent color scheme and style to make your dashboard immediately understandable.
- Context Matters: Pair raw numbers with percentage changes or benchmarks to provide context for your data.
- Interactivity: Incorporate interactive elements like date range selectors or dropdowns to allow users to drill down into the data.
Looker Studio’s flexible visualization options empower marketers to not only present their data but also to interpret it effectively, ensuring that they can react promptly and with confidence to the stories their data is telling them.
Designing Looker Studio Dashboards for Marketing Efficiency
To extract the most value from Looker Studio, it’s essential to design dashboards that are both functional and insightful. A well-structured dashboard doesn’t just display data; it tells a story and guides the user to actionable insights. Here’s a step-by-step approach to crafting an effective marketing dashboard:
Step 1: Define Your Objectives Before adding the first chart, clearly define what you want to achieve with your dashboard. Is it to track campaign performance, monitor user behavior, or measure ROI? Your objectives will determine which KPIs you should include.
Step 2: Choose the Right KPIs Select KPIs that align with your goals. For a marketing dashboard, common KPIs include traffic sources, conversion rates, and engagement metrics like page views and session duration.
Step 3: Data Sources and Integration Link your GA4 account as a data source. Ensure that you have configured GA4 to collect the necessary events and parameters that align with the KPIs you wish to track.
Step 4: Layout and Organization Organize your dashboard in a logical flow. Start with high-level metrics at the top (like DAU/WAU/MAU), and get more specific as you move down the dashboard. Group related metrics together for easier comparison.
Step 5: Visualization Selection For each KPI, choose a visualization that best represents the data:
- Use line charts for trends over time.
- Apply bar charts for comparisons between different segments.
- Opt for pie charts to show proportionate values, such as traffic distribution by channel.
Step 6: Customization and Branding Customize the look and feel of your dashboard to reflect your brand. Use consistent color schemes and add your logo to create a professional appearance.
Step 7: Interactivity and Filters Add interactive elements like filter controls for users, device types, and date ranges. This allows users to customize the view according to their needs.
Step 8: Sharing and Collaboration Set up sharing permissions and invite team members to view or edit the dashboard. Collaboration can lead to new insights and makes the data more actionable across departments.
Step 9: Quality Control is crucial to ensure the accuracy and reliability of your marketing dashboards. This step ensures that your KPIs reflect the true performance of your marketing efforts.
Step 10: Test and Iterate Once your dashboard is live, gather feedback from users and monitor its performance. Continuously refine and update your dashboard to ensure it meets your evolving marketing needs.
A well-designed Looker Studio dashboard becomes a central tool for monitoring marketing KPIs and driving data-driven decisions. By following these steps, you create a dynamic and interactive dashboard that not only tracks the necessary KPIs but also provides strategic insights that can propel your marketing efforts forward.
Read more on SaaS Product Analytics with GA4 and Looker Studio
Utilizing Data Filters for Targeted Marketing Insights
Filters are a powerful feature in Looker Studio that allow marketers to segment and analyze data dynamically, offering deeper insights into specific areas of interest. Effective use of filters can dramatically enhance the strategic value of a marketing dashboard by enabling precise, context-sensitive views of data. Here’s how to implement and benefit from data filters in your Looker Studio dashboards:
1. Define Filter Objectives
- Determine what you need to filter to align analysis with your marketing objectives. Common filters might include time periods, geographic locations, traffic sources, or user demographics.
2. Implementation of Filters
- User Segmentation: Apply filters to break down data by user types, such as new vs. returning visitors, or by customer segments identified through GA4.
- Campaign Analysis: Filter by specific marketing campaigns or channels to assess their performance and ROI.
- Geographic Targeting: Use location filters to drill down into market-specific performance, which is crucial for localized marketing strategies.
3. Custom Filter Controls
- Customize filter controls to allow users to select specific variables within the dashboard. This customization enables stakeholders to find the information that is most relevant to them without needing to navigate complex datasets.
4. Interactive Time Filters
- Incorporate time filters (like date ranges) that users can adjust to see how KPIs perform over different periods. This is especially useful for observing trends, seasonality, and the impact of specific marketing actions.
5. Saving and Sharing Filtered Views
- Enable users to save their filtered views for easy access in future sessions, enhancing the usability of the dashboard.
- Share specific views with relevant stakeholders to ensure that everyone is focused on the most pertinent data for their needs.
6. Monitoring and Optimizing Filters
- Regularly review which filters are used most and assess whether additional filters could provide further insights.
- Monitor the dashboard’s performance to ensure that filters do not slow down data loading times, which can impact user experience.
By carefully implementing and managing filters, Looker Studio dashboards can become even more valuable tools for marketers. Filters enable you to slice data in various ways, providing customized insights that can drive more informed, targeted marketing decisions.
Actionable Marketing Insights from Looker Studio Reports
Once your Looker Studio dashboard is set up with relevant KPIs and enhanced with filters for precise analysis, the next step is to translate these insights into actionable marketing strategies. Here’s how to leverage the data from your Looker Studio reports to make informed decisions that can significantly impact your marketing efforts.
1. Identifying Opportunities for Improvement
- Performance Gaps: Use the dashboard to pinpoint areas where performance doesn’t meet expectations. For instance, if the conversion rates from a specific traffic source are low, consider revising the associated campaign or experimenting with different content.
- User Behavior Trends: Insights into user behavior, such as high bounce rates on key pages, can indicate where improvements in user experience or content might be necessary.
2. Optimizing Marketing Campaigns
- Refine Targeting: With demographic and geographic data, refine your targeting to focus more on the segments that show higher engagement and conversion rates.
- Adjust Budget Allocation: Analyze the ROI from different channels and campaigns to reallocate budgets to the most effective ones, maximizing your marketing spend efficiency.
3. Enhancing User Engagement
- Content Personalization: Utilize data on user preferences and behaviors to tailor content, making it more relevant and engaging to different user segments.
- Website Optimization: Implement changes based on user interaction data, such as optimizing the layout of high-traffic pages or enhancing the mobile user experience.
4. Forecasting and Planning
- Trend Analysis: Use historical data trends to forecast future behavior and plan marketing activities around anticipated peaks in user activity or interest.
- Scenario Planning: Apply what-if scenarios to test how changes in marketing strategies could affect KPIs, allowing for better strategic planning.
5. Continuous Learning and Adaptation
- Feedback Loops: Establish mechanisms to continuously gather and incorporate feedback from various channels into your dashboard. This helps in refining your tactics and adapting to changes in consumer behavior or market conditions.
- A/B Testing: Regularly test different approaches directly informed by dashboard insights to find the most effective tactics.
6. Reporting and Communication
- Stakeholder Reports: Create custom reports for different stakeholders with insights that are directly relevant to their specific concerns or areas of responsibility.
- Performance Reviews: Use dashboard insights for regular performance reviews and strategic meetings to ensure alignment across your organization.
Addressing Advertising and Conversion Rate Optimization
Effective marketing dashboards should provide clear insights into advertising performance and conversion rate optimization (CRO). By creating dedicated reports for these areas in Looker Studio, marketers can further refine their strategies and improve ROI. Here’s how to construct these critical reports:
1. Advertising Report
- Key Metrics: Focus on metrics like Cost-per Action (CPA) Click-Through Rate (CTR), Cost per Click (CPC), and Return on Ad Spend (ROAS). These indicators help assess the effectiveness and efficiency of advertising campaigns.
- Visualization Techniques: Use line charts to track changes in CTR and CPC over time. Bar charts can compare the performance of different campaigns or ad platforms side-by-side, and pie charts might illustrate budget allocation or share of spend by channel.
- Data Segmentation: Segment data by demographics, geographic location, or device type to uncover deeper insights into which factors influence ad performance. This can help tailor future ad campaigns to target high-performing segments.
2. Conversion Rate Optimization Report
- Conversion Funnel Analysis: Visualize the conversion funnel to identify drop-off points. This can be depicted through funnel diagrams that show user flow from initial engagement through to conversion.
- Page-Level Insights: Use heatmaps or scroll maps to analyze user interactions on key landing pages. Understanding where users click, what they ignore, and how far they scroll can provide actionable insights to enhance page design and functionality.
- A/B Testing Results: Include results from A/B tests in a comparative format, such as side-by-side bar charts for different variations of a webpage. This helps in determining which changes lead to higher conversion rates.
3. Integrating Insights into Broader Marketing Activities
- Actionable Recommendations: Each report should not only present data but also offer actionable recommendations based on the analysis. For instance, if certain ad creatives generate higher engagement, the report should suggest increasing focus or budget on those creatives.
- Feedback Integration: Use feedback from the teams involved in advertising and CRO to refine the reports continually. You can directly integrate a spreadsheet or an iFrame into looker studio pages. This collaborative approach ensures the reports remain relevant and highly actionable.
Final Words
Looker Studio’s capability to provide real-time, interactive, and highly customizable reports allows marketing teams to stay agile—adapting strategies swiftly in response to consumer behavior and market conditions. The dashboards not only serve as a central platform for monitoring essential marketing KPIs but also act as a collaborative tool, enhancing communication across teams and aligning marketing efforts with broader business objectives.
Furthermore, specialized reports on advertising performance and conversion rate optimization equip marketers with the tools to fine-tune campaigns, maximize ROI, and improve overall marketing effectiveness. These insights enable businesses to not just react to market dynamics but to anticipate changes and strategically position themselves in competitive landscapes.
As digital marketing continues to evolve, the integration of advanced tools like Looker Studio with comprehensive data sources such as GA4 will be crucial in shaping the future of marketing analytics. Marketers who leverage these tools will find themselves well-equipped to navigate the complexities of modern marketing campaigns, ensuring their strategies are data-driven, effective, and aligned with their business goals.
Frequently Asked Questions about Marketing KPIs and Looker Studio
What are marketing KPIs and why are they important?
Marketing KPIs (Key Performance Indicators) are measurable values used by marketing teams to evaluate the success of their campaigns against predefined targets. They are crucial because they help businesses assess the effectiveness of their marketing activities, optimize strategies, and allocate resources more efficiently.
How does Looker Studio help in tracking marketing KPIs?
Looker Studio, integrated with Google Analytics 4, allows marketers to visualize complex data through customizable dashboards. This enables the tracking of real-time data and helps in making informed decisions by displaying trends, patterns, and insights in an easily digestible format.
Can I connect Looker Studio directly to Google Analytics 4?
Yes, Looker Studio can be directly connected to Google Analytics 4. This integration allows you to pull data automatically into Looker Studio, facilitating real-time data analysis and reporting.
What are some essential marketing KPIs to track in Looker Studio?
Essential marketing KPIs to consider include Traffic Acquisition Metrics (like sessions and users), Conversion Rates, Engagement Metrics (such as average session duration and bounce rate), and E-commerce Conversion Rates.
How can I customize my dashboard in Looker Studio for better insights?
Customizing your Looker Studio dashboard involves selecting the right metrics, applying filters like date ranges or demographic data, and choosing visual formats (like graphs or charts) that best represent your data. It’s also important to regularly update your dashboard to reflect new data and insights.
What are the advantages of using GA4 with Looker Studio for KPI management?
GA4 provides a user-centric measurement framework that is flexible and privacy-focused, making it ideal for modern web analytics. When used with Looker Studio, GA4 supports detailed user behavior analysis, enhanced conversion tracking, and cross-platform measurement, allowing for comprehensive KPI management.
Are there any best practices for designing effective marketing dashboards in Looker Studio?
Best practices for designing effective marketing dashboards include keeping the design simple and focused, using consistent visual elements, ensuring the data is up-to-date, and incorporating interactive elements such as filters and drill-down capabilities to allow users to explore the data more deeply.