Your cart is currently empty!


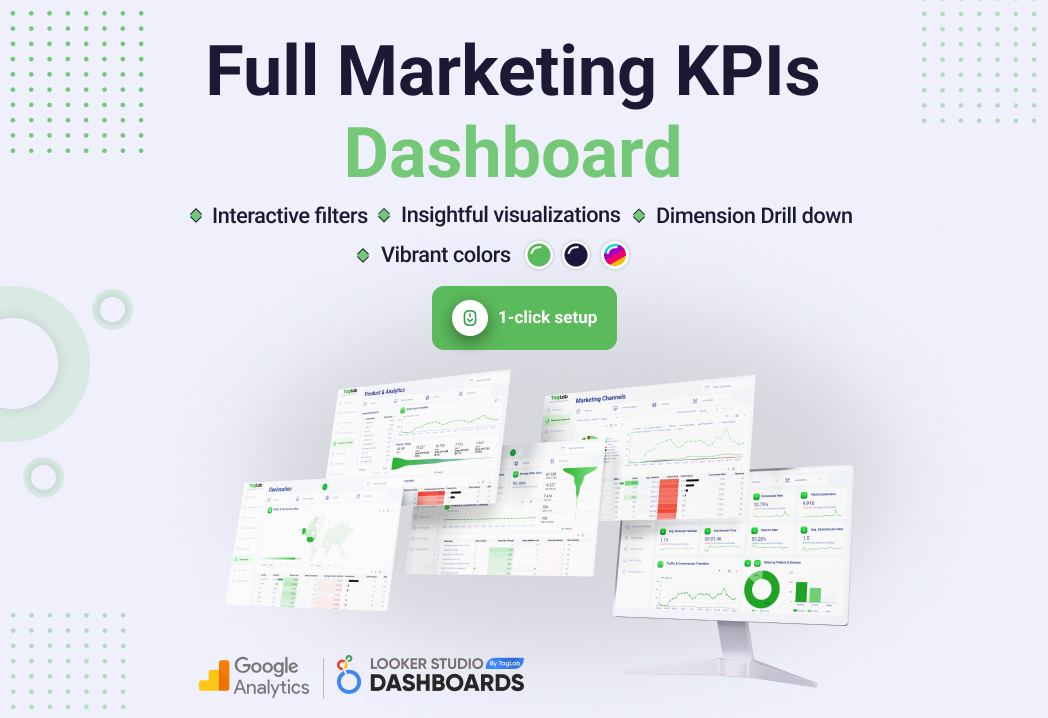
Marketing Analytics Full KPI Framework Dashboard Template
$0.00
TagLab’s comprehensive marketing analytics KPIs dashboard offers a one-click solution to connect Google Analytics 4 data, featuring interactive filtering, nine detailed KPI reports, and expansive drill-down options—all displayed through over fifty dynamic widgets for comprehensive marketing insights.
Dashboard Specs
- Fully interactive dashboard with Google Analytics Data for Marketing KPIs
- 1 Click plug-in
- 9 Marketing KPI reports
- Dropdown filters by date, medium, device category, country, and website hostname
- Filter by more than 20 dimensions just by clicking on charts
- Custom sorting and report export
- Drill down by dimensions (for example Channel Group > Medium > Source Campaign or Year > Month > Week > Day
- More than 50 widgets
TagLab’s Analytics Dashboard with Google Analytics and Looker Studio transforms your marketing data into actionable insights with a user-friendly interface. Effortlessly connect to Google Analytics 4 with just one click, unlocking a suite of over fifty widgets. The dashboard offers an array of interactive features including dropdown filters for date ranges, mediums, device categories, countries, and hostnames, providing a holistic view of your marketing performance.
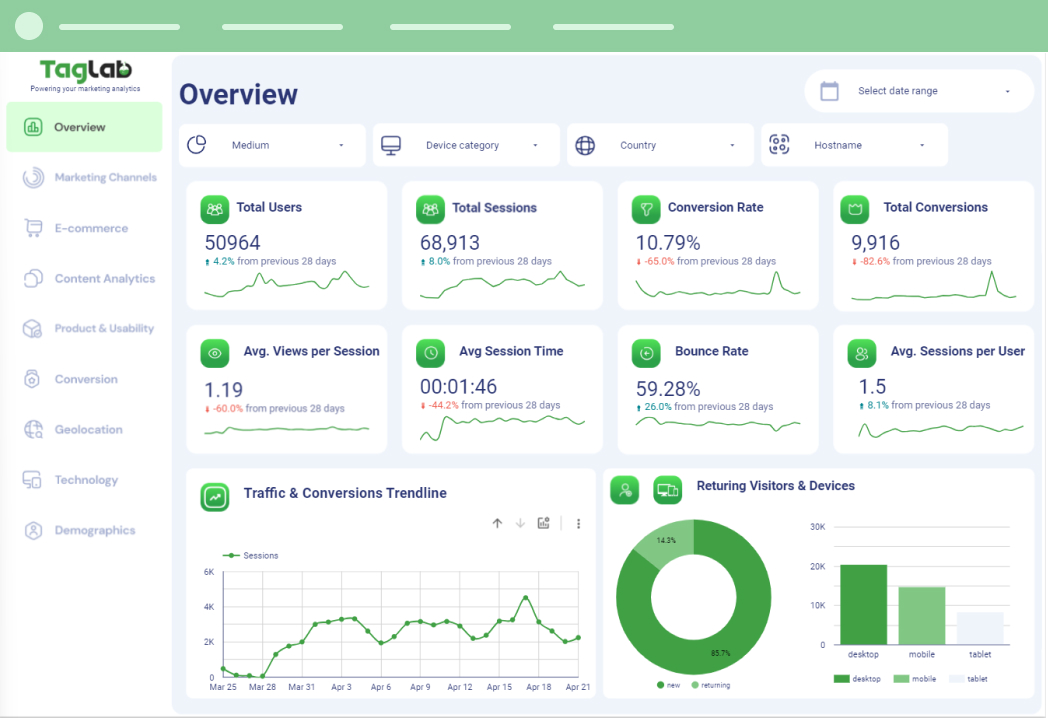
Overview Report
Consolidated Marketing Health A dashboard summary that gives a snapshot of total users, sessions, conversion rates, and other key metrics to quickly assess the overall health and effectiveness of your marketing efforts.
Each dashboard is designed to be interactive and customizable, giving you the power to focus on what matters most to your business. With TagLab, you are equipped to make data-driven decisions that can lead to improved user experiences and enhanced marketing ROI.
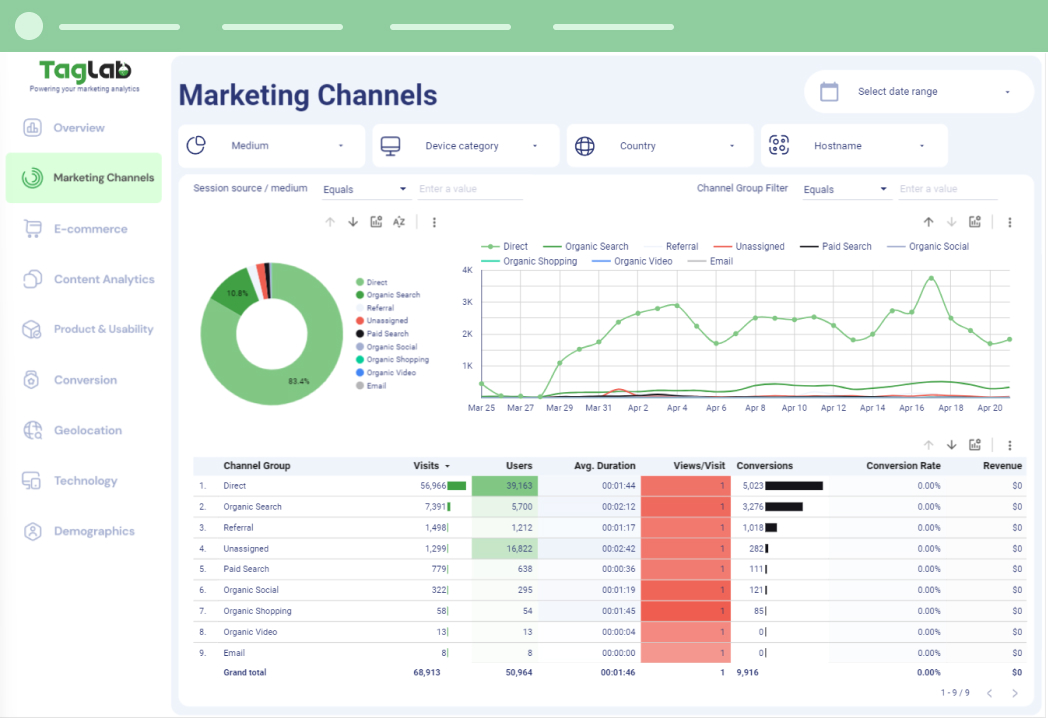
Marketing Channels Report
Acquisition & Channel Effectiveness View traffic sources and evaluate the performance of each marketing channel. Adjust your strategy based on which channels bring the most valuable traffic and conversions.
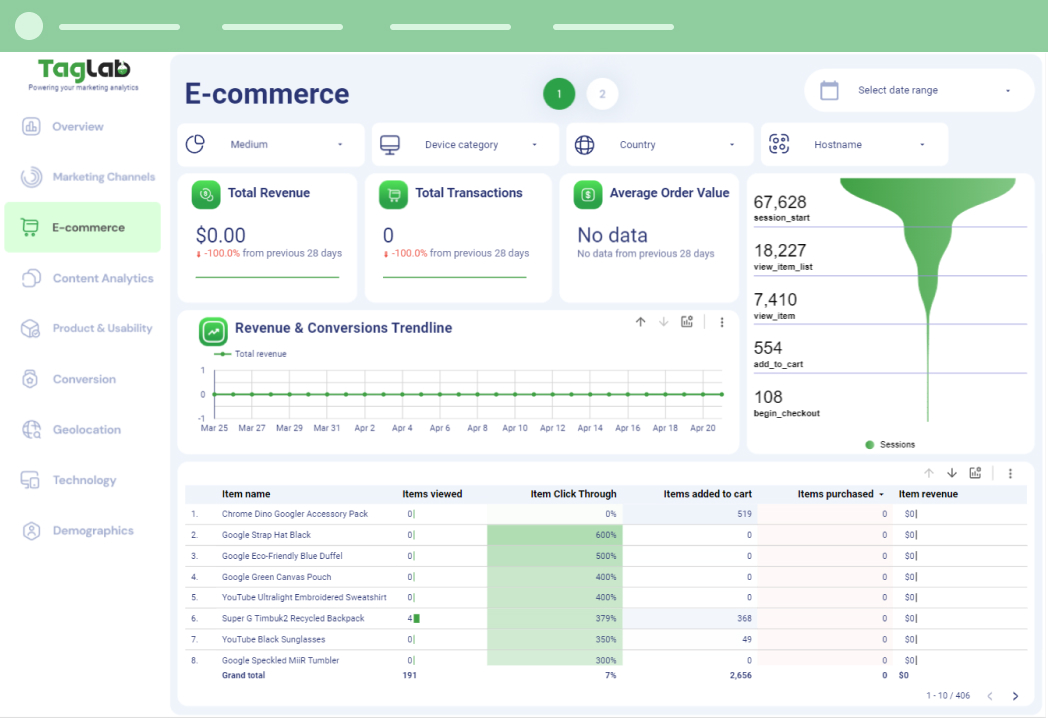
E-commerce Report
Sales Performance & Product Interest For e-commerce stores, track product performance and shopping behavior. View items added to cart, click-through rates, and other e-commerce specific metrics to understand purchasing patterns.
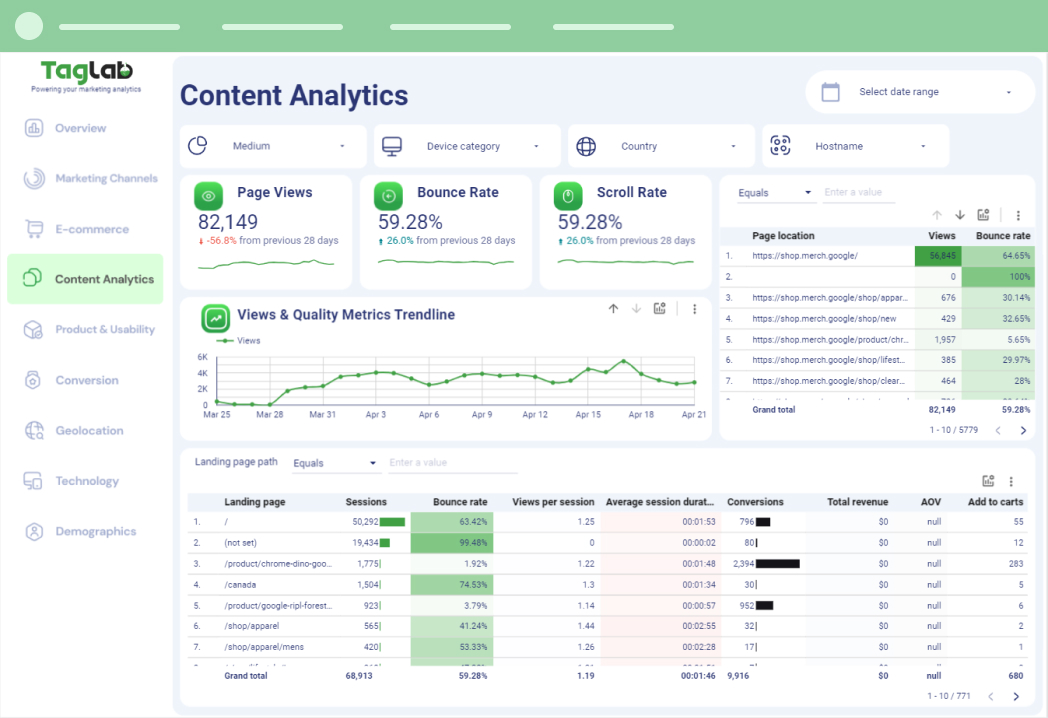
Content Analytics Report
Content Engagement & Quality Metrics Measure the impact of your content. From page views to scroll rates, understand which content keeps users engaged and identify pages that might be underperforming.
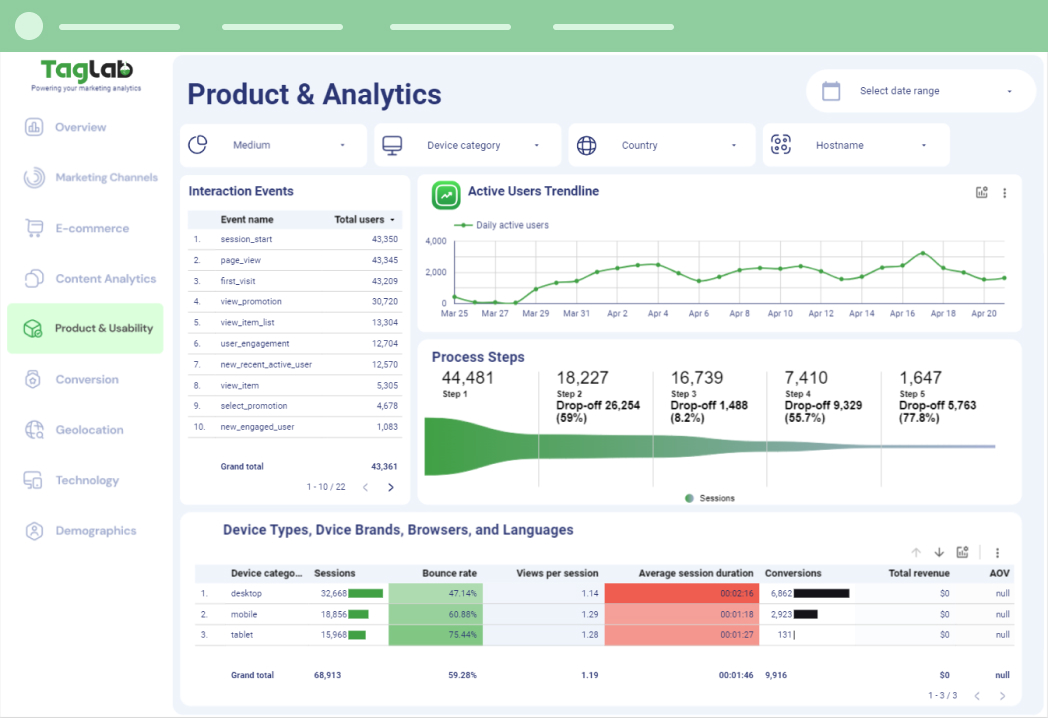
Product & Usability Report
User Interactions & Funnel Analysis Delve into product interactions and process bottlenecks. This report illustrates user engagement through event tracking and visualizes drop-offs in the conversion funnel, highlighting areas for improvement.
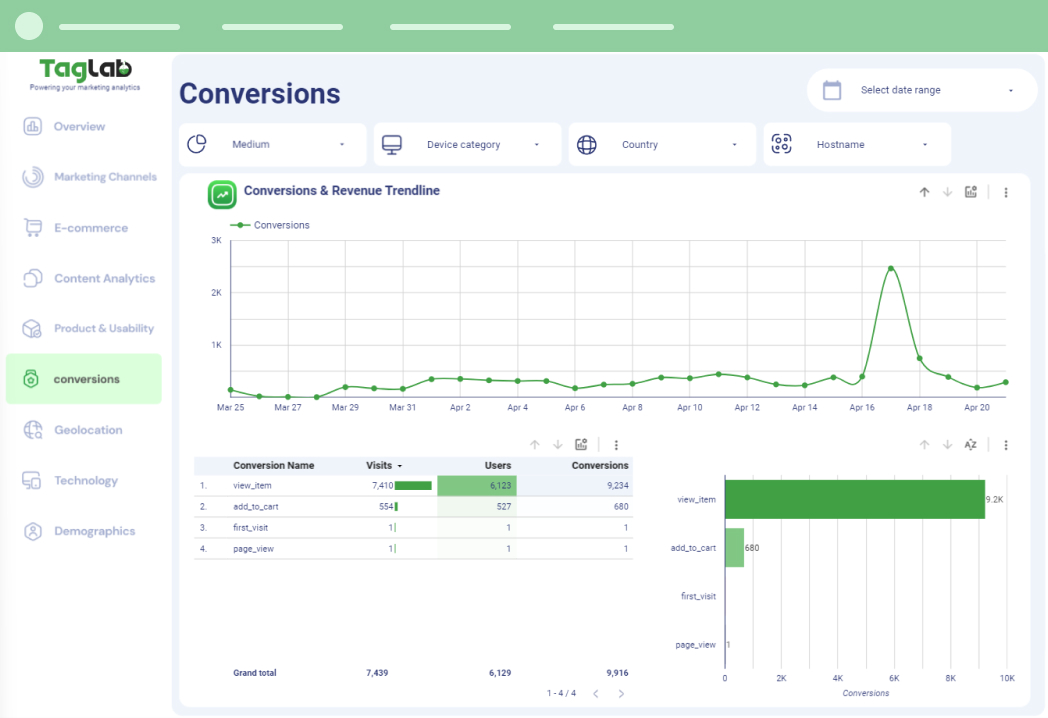
Conversions Report
Detailed Conversion Metrics Track your funnel’s performance with granular conversion data. Identify which actions are leading to conversions, and optimize the user journey for maximum efficiency and revenue generation.
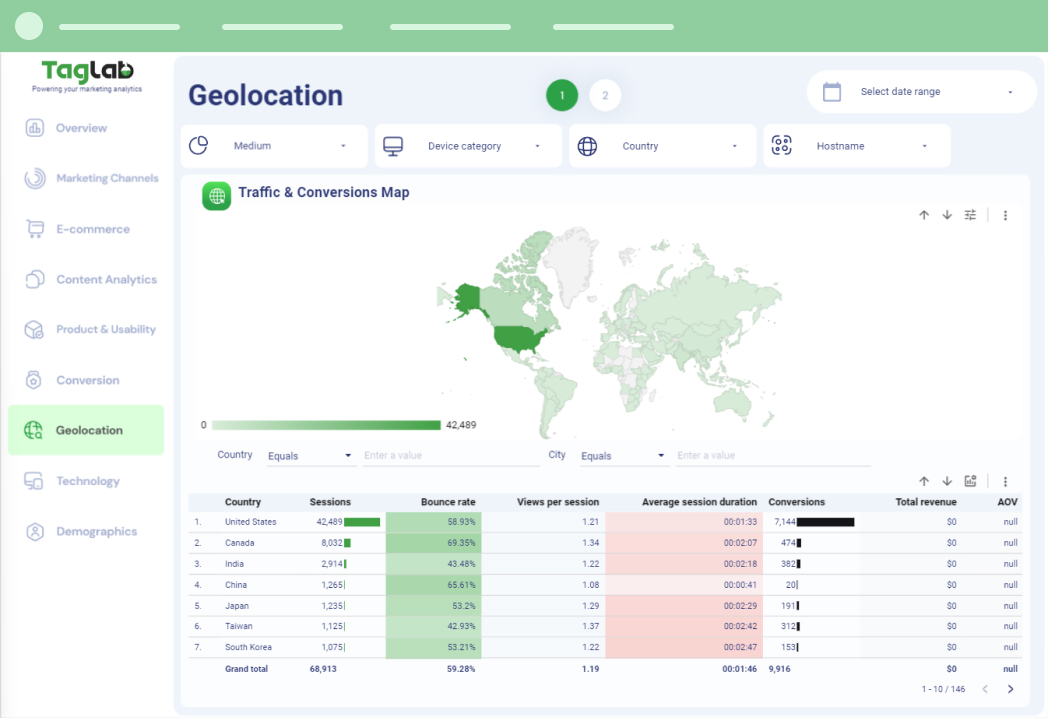
Geolocation Report
Traffic & Conversion by Location Discover geographical trends in user engagement and conversion. With data visualized on a world map, easily identify top-performing countries and cities, adapting your strategies to where your audience resides.
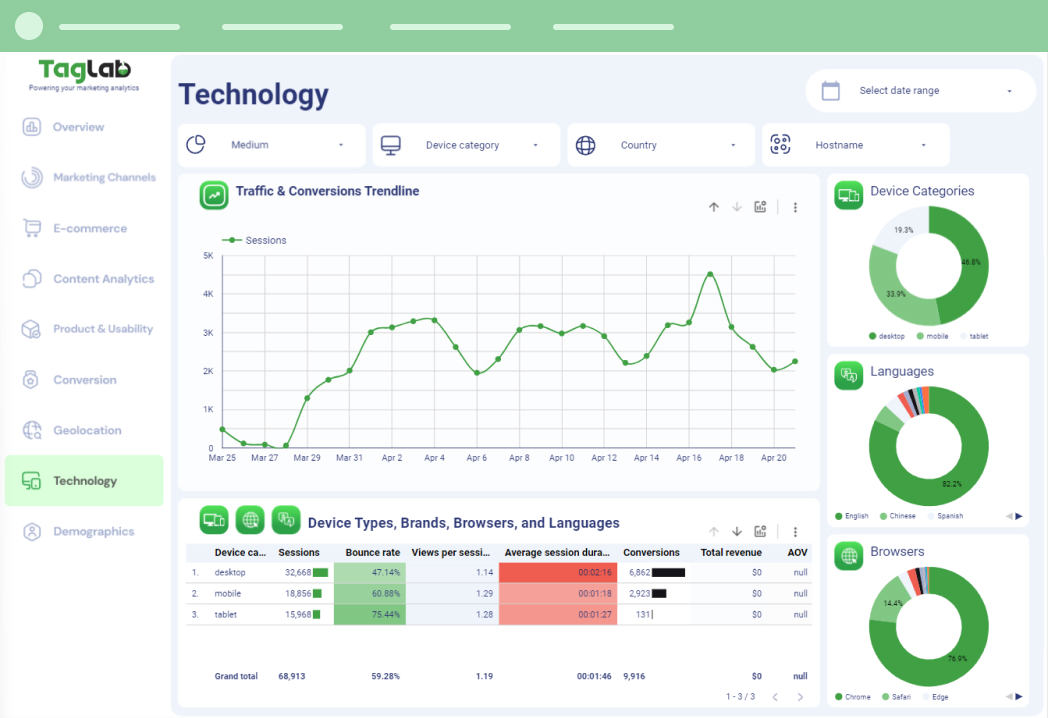
Technology Report
Device Usage & Engagement Analyze how different technologies impact user behavior. This section covers device categories, browser types, and languages, providing insights into how each segment interacts with your content, from session counts to bounce rates.
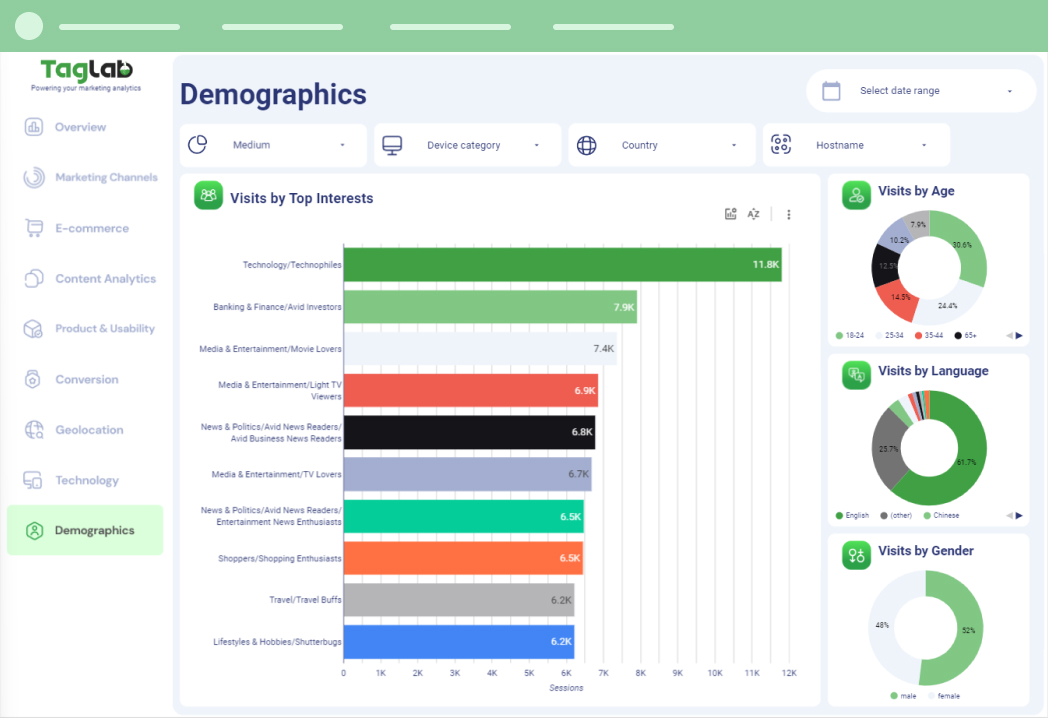
Demographics Report
Visits by Top Interests & User Attributes Understand your audience with a comprehensive breakdown of visits by user interests, age, language, and gender. Tailored for marketers, this report segments your audience to refine targeting and personalize campaigns.
| Visualization Platform | Google Looker Studio |
|---|---|
| Data Source | Google Analytics 4 |
| Connector Type | Google Native Free Connector |
| Basic Metrics Requirements | This dashboard requires Google Analytics 4 tracking code running your website for most of the basic metrics (Visits, Users, Views, Geolocation etc..) |
| E-commerce Requirements | This template requires Google Analytics 4 Ecommerce implementation to be in place to display e-commerce metrics such as purchases, transactions, revenue, add to cart, and product metrics. |
| Custom Events Requirements | Custom events and their parameters, relevant for your business must be implemented on your website or mobile application |
| Dashboard Personalization Requirements | Only e-commerce events will work out of the box in this dashboard if implemented. Other custom events might need a minor tweaking of the dashboard to display properly. |
| Other Info | We provide full dashboard configuration and adaptation support. |
Related products
-

Geolocation, Technology & Demographics KPIs Dashboard
$0.00 -
Conversions & Product Usability KPIs Dashboard
$0.00 -
Content Analytics Metrics Dashboard
$0.00 -
E-commerce Analytics Metrics Dashboard
$0.00 -
KPI Overview and Marketing Channels Dashboard Template
$0.00


