Your cart is currently empty!


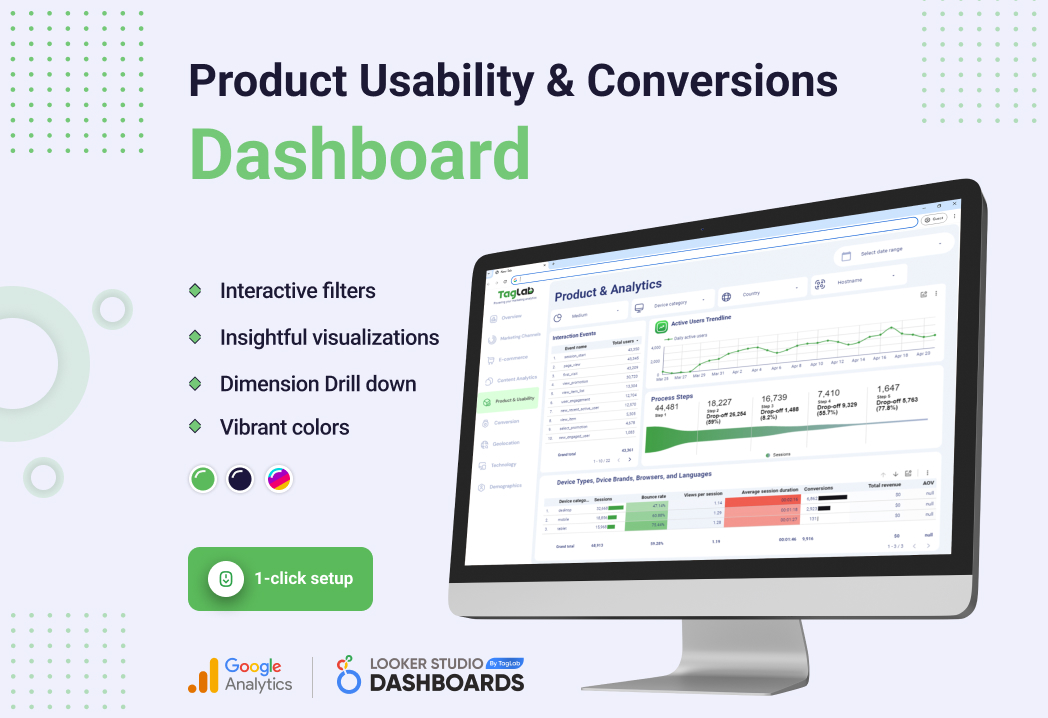
Conversions & Product Usability KPIs Dashboard
$0.00
Maximize usability and conversions with TagLab’s Product & Analytics Dashboard, featuring detailed reports on user interactions and conversion metrics in Looker Studio.
Dashboard Specs
- Fully interactive dashboard with Google Analytics Data for Marketing KPIs
- 1 Click plug-in
- 3 KPI reports (Overview, Product & Usability, and Conversions)
- Dropdown filters by date, medium, device category, country, and website hostname
- Daily, Weekly, and Monthly active users
- Process steps funnel chart
- Main events and conversions view and filters
- Trendlines by custom events, conversions, sessoins, users, or event revenue
- Custom sorting and report export
- Customizable 7 report widgets
TagLab’s dual-faceted Product & Analytics and Conversions Reports provide a deep dive into product interaction and conversion pathways. Integrated directly with Google Analytics 4 and displayed through Looker Studio, these reports deliver insights on how users interact with your products and the effectiveness of your conversion funnel.
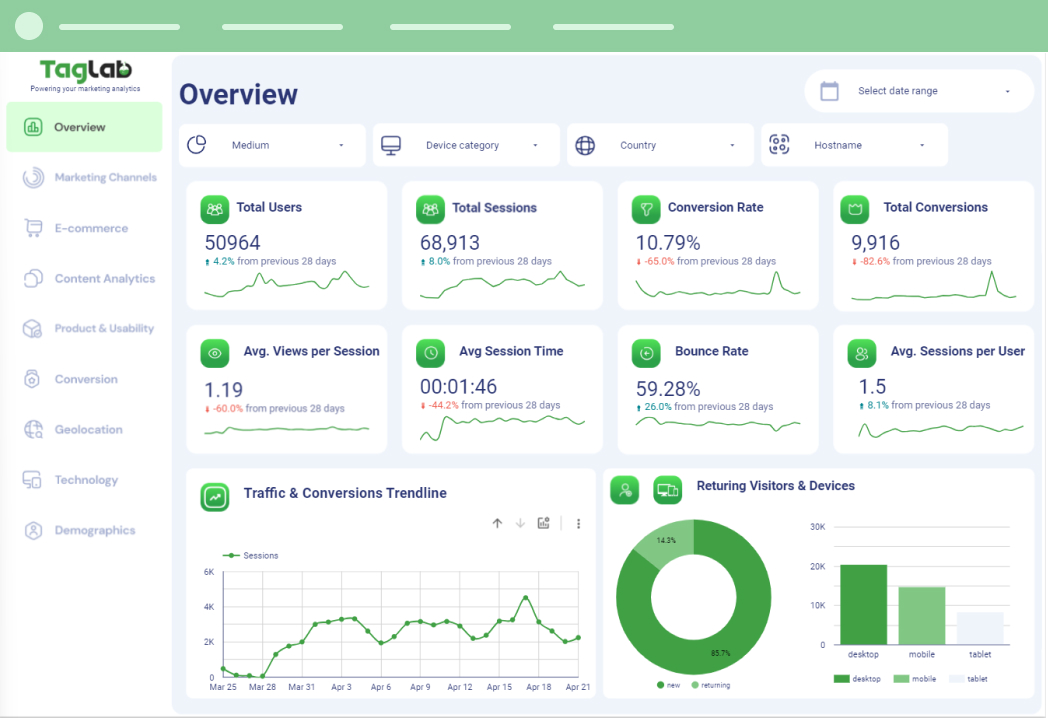
Overview Report
Consolidated Marketing Health A dashboard summary that gives a snapshot of total users, sessions, conversion rates, and other key metrics to quickly assess the overall health and effectiveness of your marketing efforts.
Each dashboard is designed to be interactive and customizable, giving you the power to focus on what matters most to your business. With TagLab, you are equipped to make data-driven decisions that can lead to improved user experiences and enhanced marketing ROI.
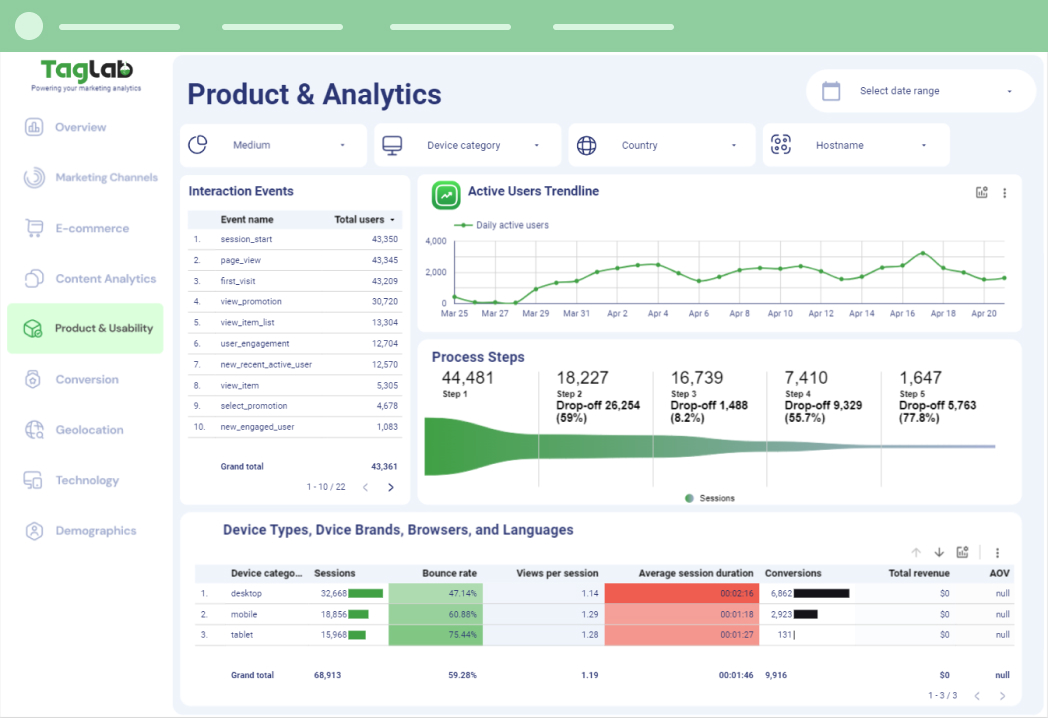
Product & Usability Report
In-Depth User Interaction Tracking From first visits to promotional views, the Product & Analytics Report captures every user interaction. It lays out the path to engagement through event tracking and provides a comprehensive look at active users over time, giving you a clear understanding of user behavior and product interaction patterns.
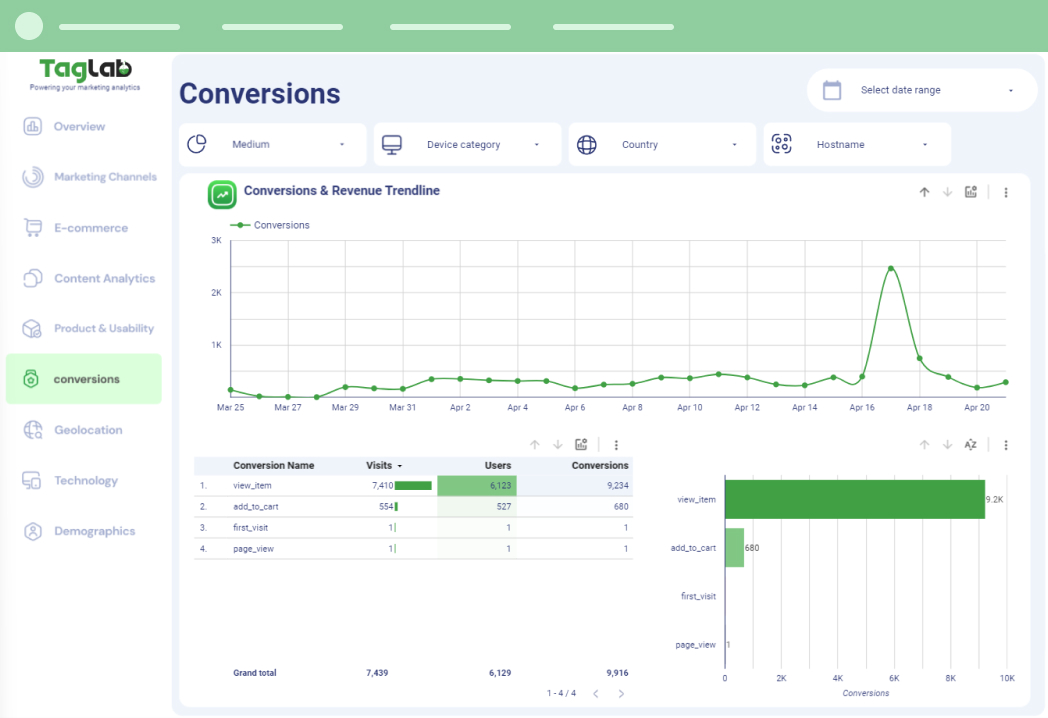
Conversion Tracking Report
Conversion Optimization Analysis The Conversions Report zeroes in on the outcomes of your user engagement strategies. It presents a Conversion & Revenue Trendline along with detailed data on visits, users, and conversion rates for key actions like item views and cart additions. Use this data to optimize every step of the customer journey towards purchase.
| Visualization Platform | Google Looker Studio |
|---|---|
| Data Source | Google Analytics 4 |
| Connector Type | Google Native Free Connector |
| Basic Metrics Requirements | This dashboard requires Google Analytics 4 tracking code running your website for most of the basic metrics (Visits, Users, Views, Geolocation etc..) |
| E-commerce Requirements | This template requires Google Analytics 4 Ecommerce implementation to be in place to display e-commerce metrics such as purchases, transactions, revenue, add to cart, and product metrics. |
| Custom Events Requirements | Custom events and their parameters, relevant for your business must be implemented on your website or mobile application |
| Dashboard Personalization Requirements | Only e-commerce events will work out of the box in this dashboard if implemented. Other custom events might need a minor tweaking of the dashboard to display properly. |
| Other Info | We provide full dashboard configuration and adaptation support. |
Related products
-

Geolocation, Technology & Demographics KPIs Dashboard
$0.00 -
Content Analytics Metrics Dashboard
$0.00 -
E-commerce Analytics Metrics Dashboard
$0.00 -
KPI Overview and Marketing Channels Dashboard Template
$0.00 -
Marketing Analytics Full KPI Framework Dashboard Template
$0.00


